The 2-Minute Version
- Don't compare your debt rate to "the market does 10%." Compare it to what stocks are realistically expected to return over the next few years (after-tax).
- At today's valuations that expected return for the market moving forward is low. Once you add a physician's high tax rate, paying down any debt above about 4% wins for most.
- List every debt, attack the highest rate first.
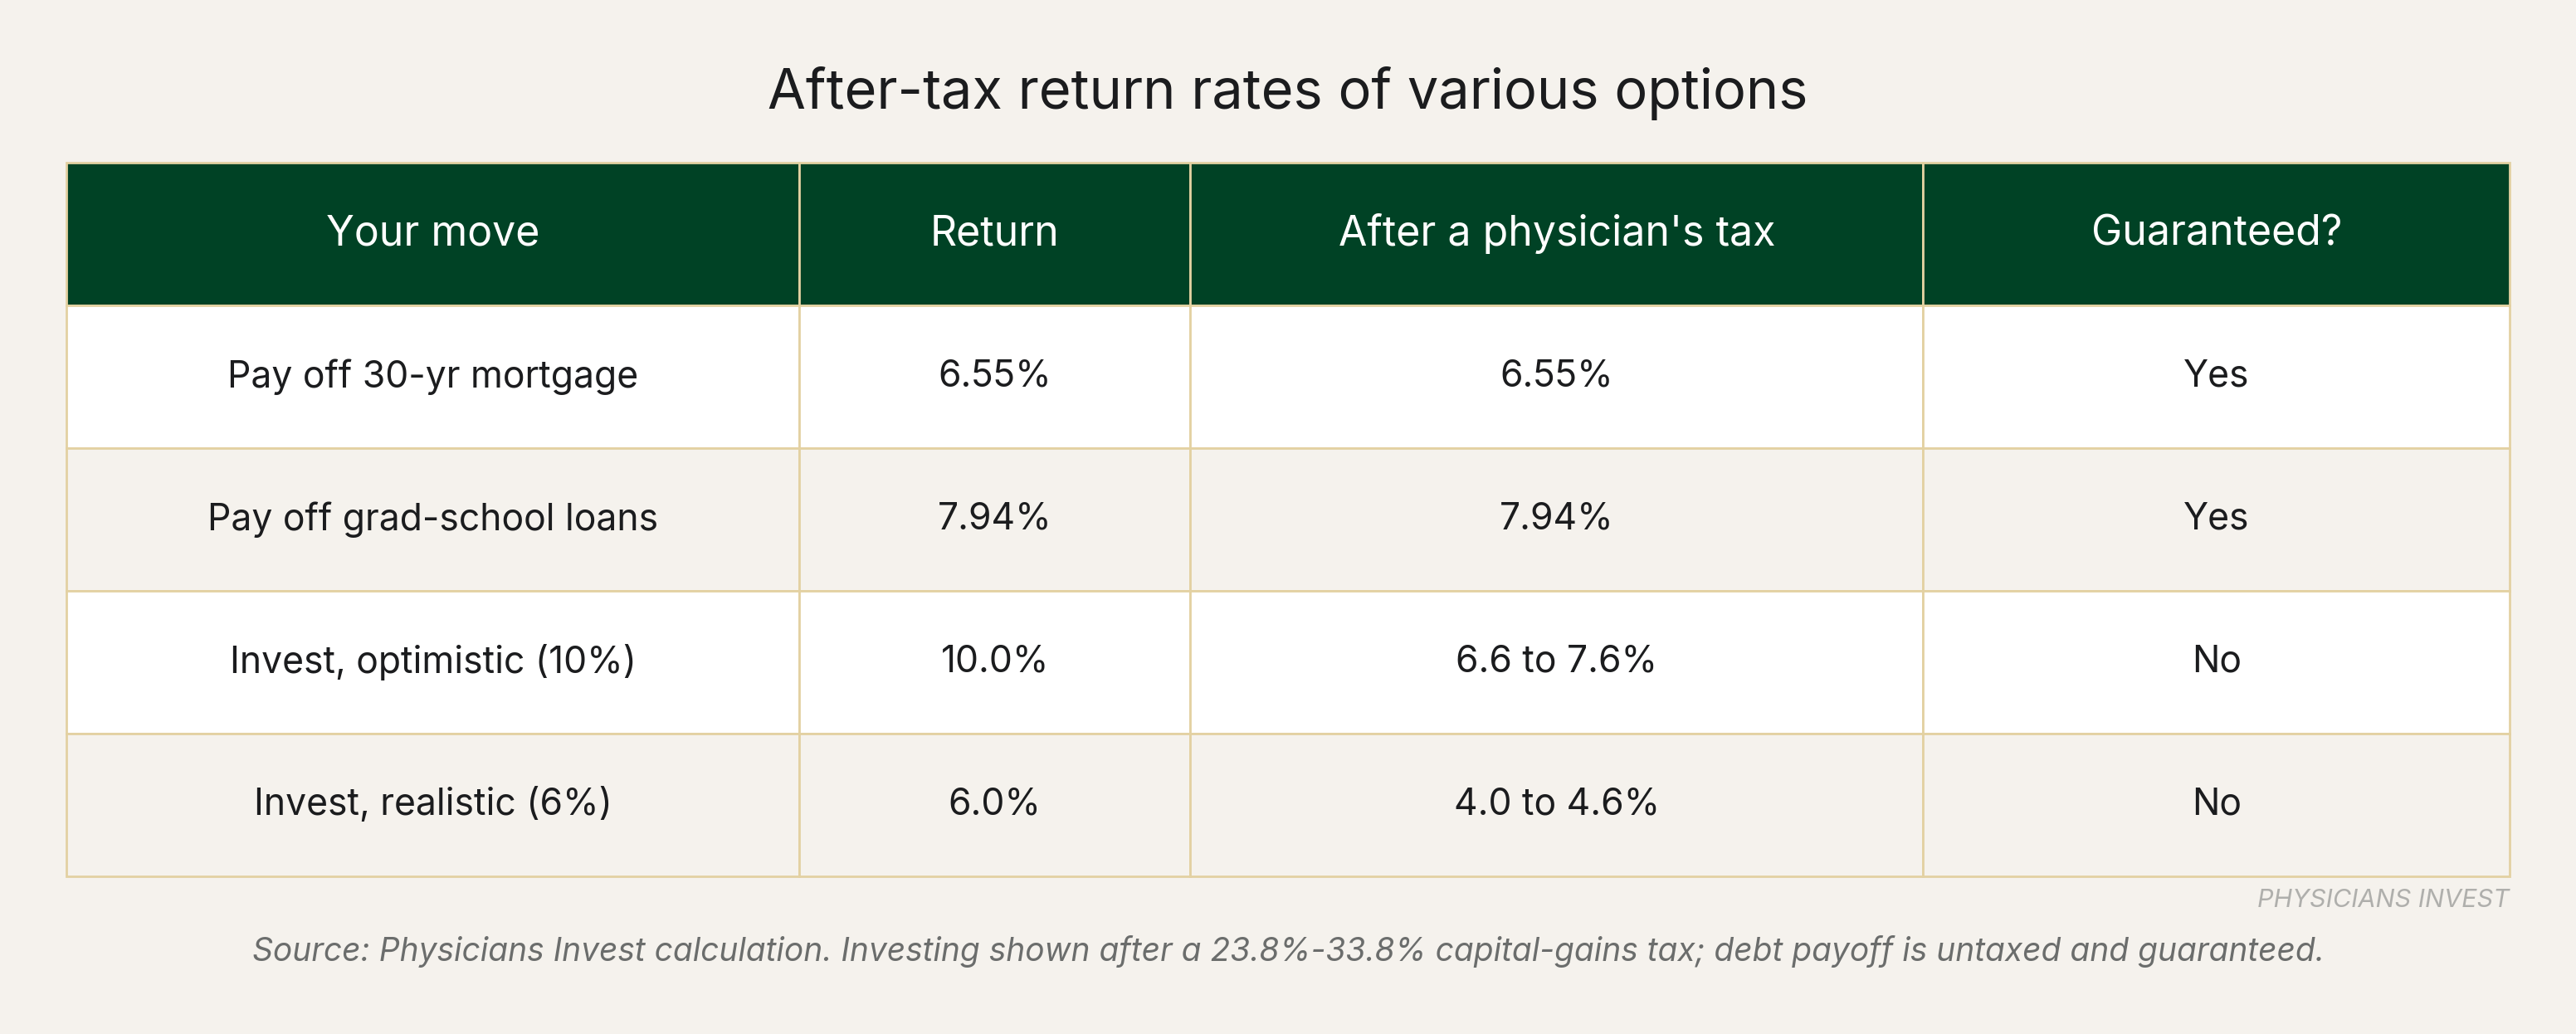
The Dollar Math Paying off $100,000 of 6.55% debt effectively locks in a guaranteed, tax-free return of $6,550 a year. At today's stretched valuations the same $100,000 invested is expected to net closer to $4,000 after a physician's capital-gains tax, and that number isn't guaranteed.
A question that often comes up in our conversations with physicians is, "Should I invest or should I pay off my debt with my excess cash?". Our view is that in most cases, the math supports paying off the debt first. Many physicians respond to that suggestion with "But I think I can get 10% in the market so why wouldn't I do that if my rate on debt is 6%." The short answer is those are headline numbers and we need to adjust for a few things.
The Setup
Physicians aren't wrong that about 10% is what the market has averaged over a long history (measured by the S&P 500). The long-term average is over a century and many decades have produced far more and also far less than 10%. A better way to approach expected market returns is to look at what the market is expected to do going forward and not to just extrapolate the recent past. Markets are cyclical.
Further, taxes play a huge component in the decision to pay off debt or to invest and should be a major factor in the analysis.
The Analysis
The market side: how to figure out what stocks are expected to return
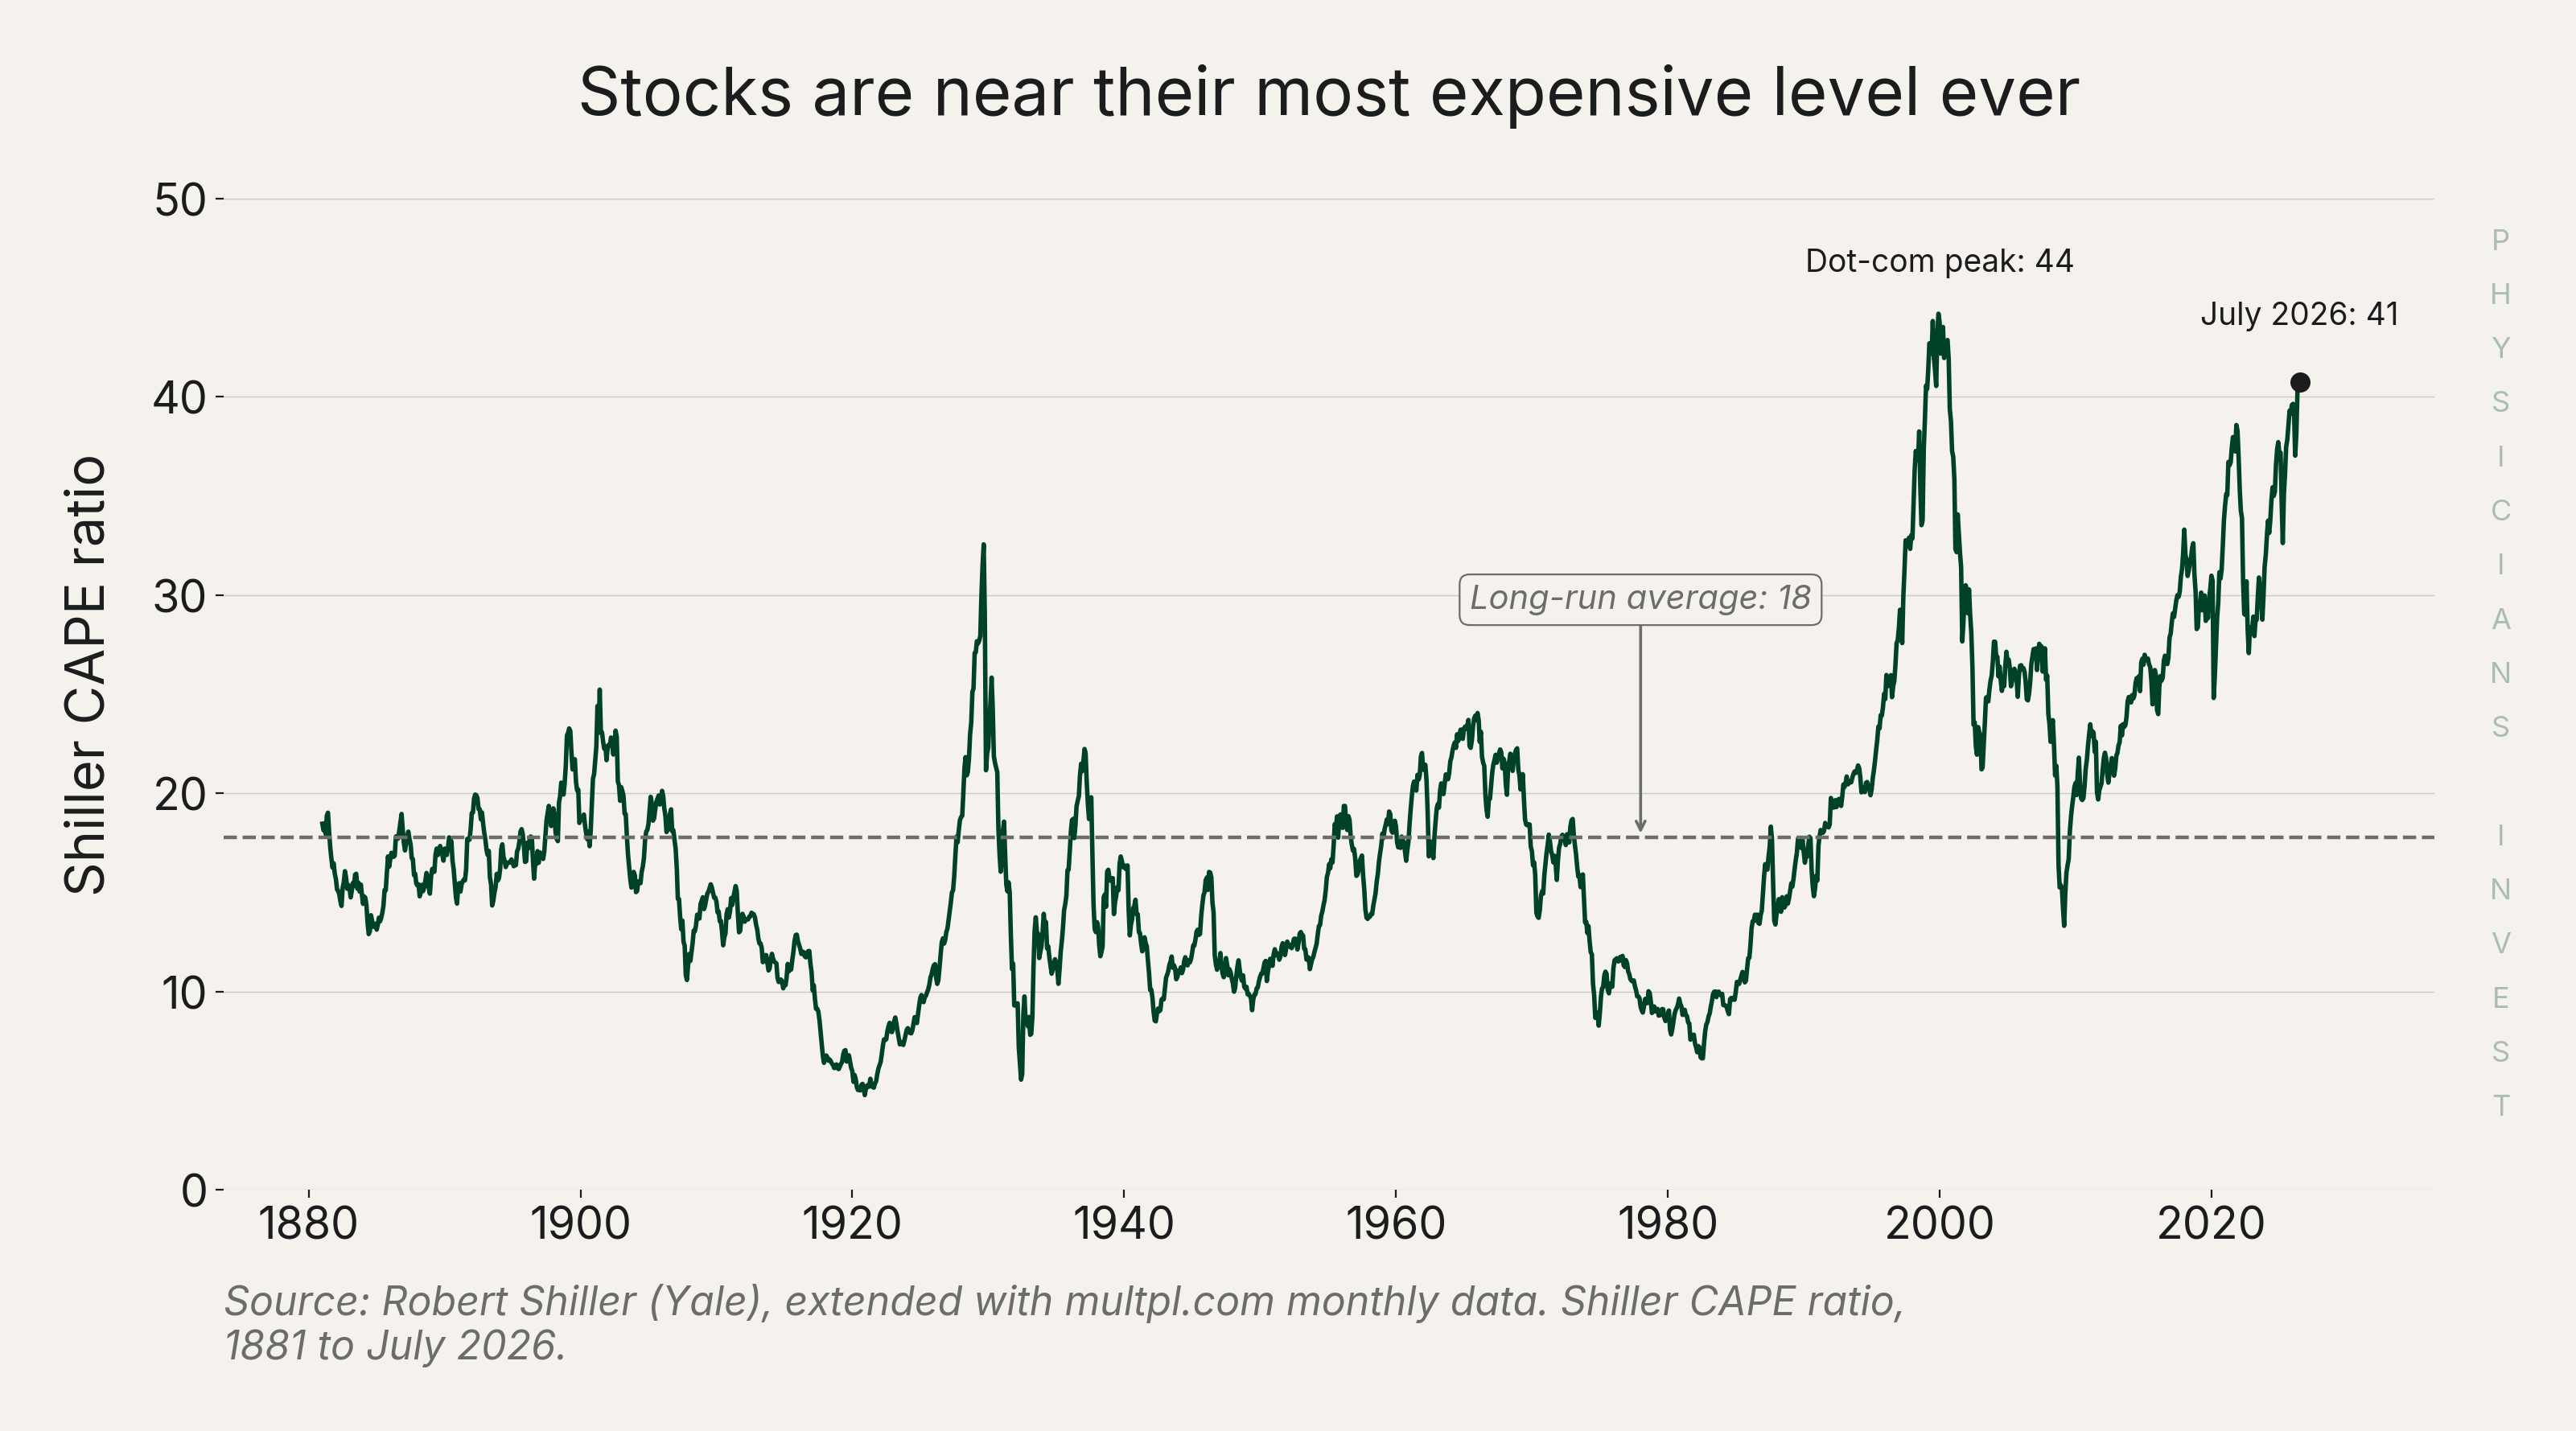
Start with valuation. What is the valuation of the stock market today compared to history? One of the standard gauges of valuation is the Shiller CAPE (the cyclically adjusted price-to-earnings ratio). The way the ratio works is it divides the current market price (measured by total market cap) by the average of 10 years of inflation-adjusted earnings. A high number means you're paying a lot for each dollar of earnings. Using history as a guide, the more you pay for equivalent earnings, the less you tend to earn later. A plot of this ratio over time is plotted below. Notice where we sit today.
 Source: Robert Shiller (Yale), extended with multpl.com
Today the CAPE sits around 41. The long-run average is about 18, and the only time it was higher than its current reading was the 2000 dot-com peak. You can check it yourself, free, at multpl.com/shiller-pe.
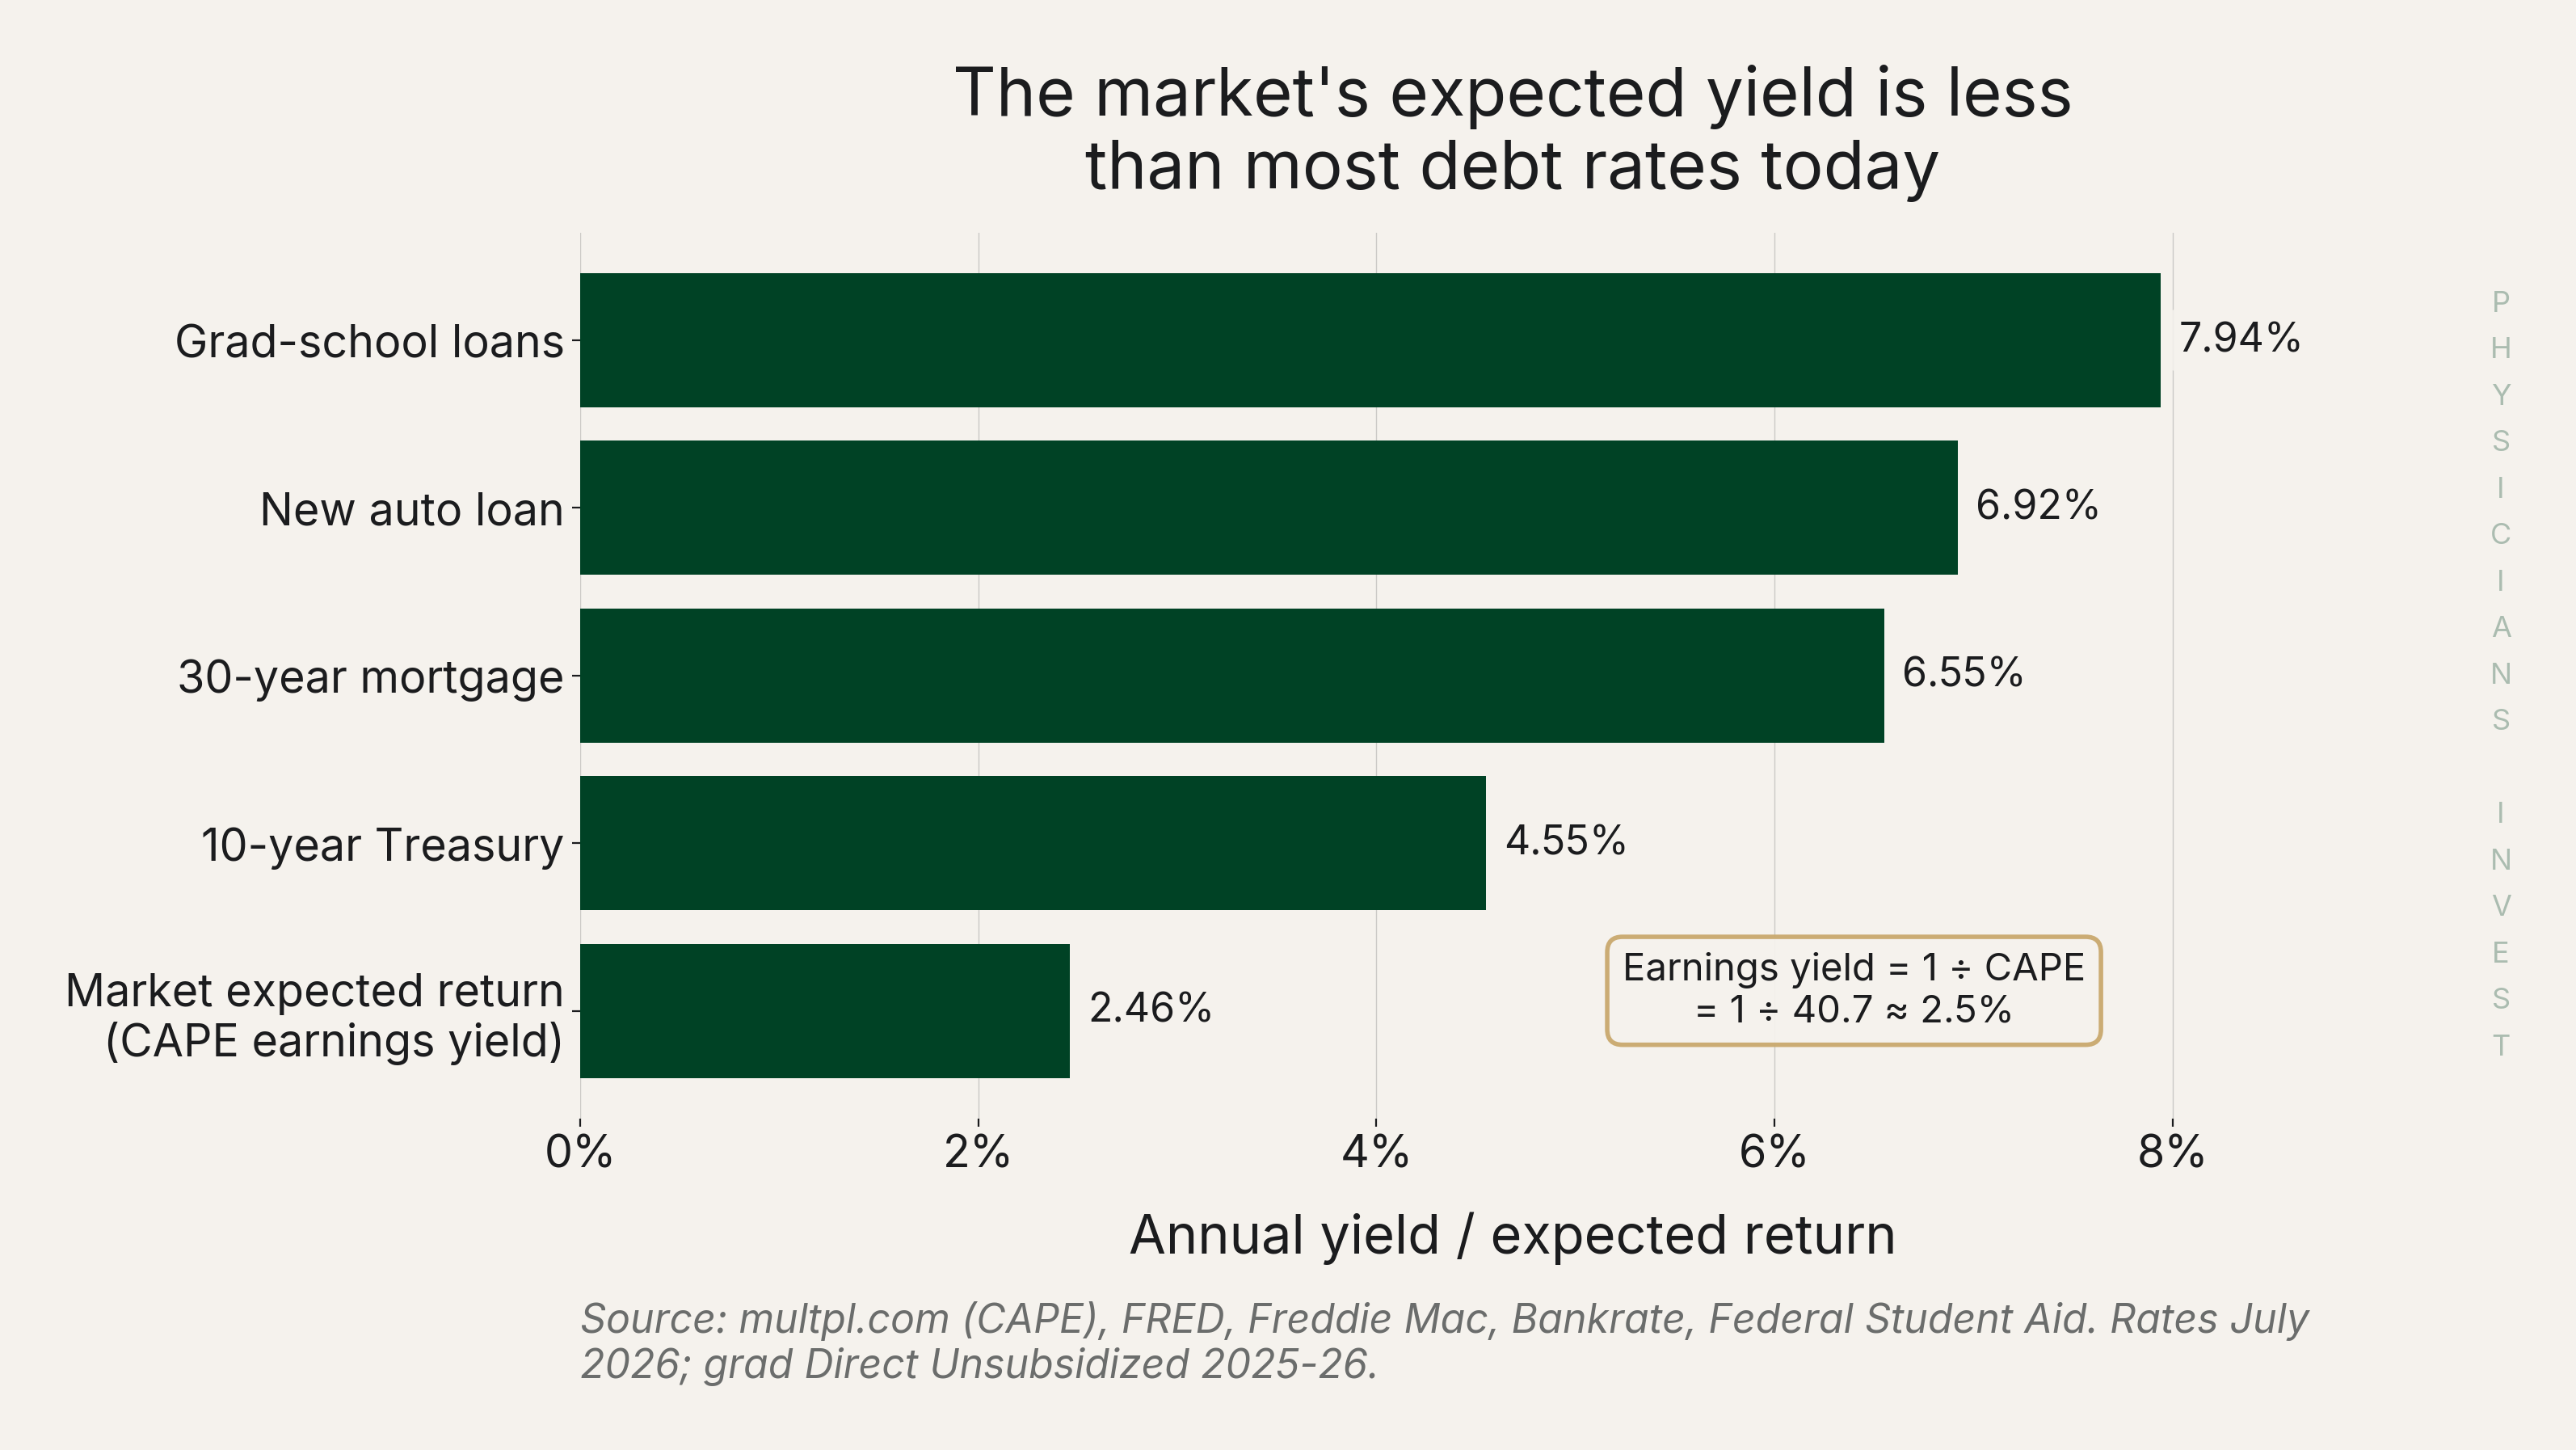
This metric can be a little hard to get your head around so we will walk through how to convert this metric into something meaningful. To turn that ratio into an expected return, flip it over. Instead of price/earnings do earnings/price. This gives you what is called the earnings yield and it makes market valuations much more comparable now to debt yields. If we do that math for 1 ÷ 41, it comes out to about 2.5%. At today's price, the earnings the market throws off are only about 2.5% of what you paid for them. This can be used as a rough proxy for what stocks are expected to return in real terms from here. Now we can set that yield next to debt yields and compare.
 Source: multpl.com (CAPE), FRED, Freddie Mac, Bankrate, Federal Student Aid
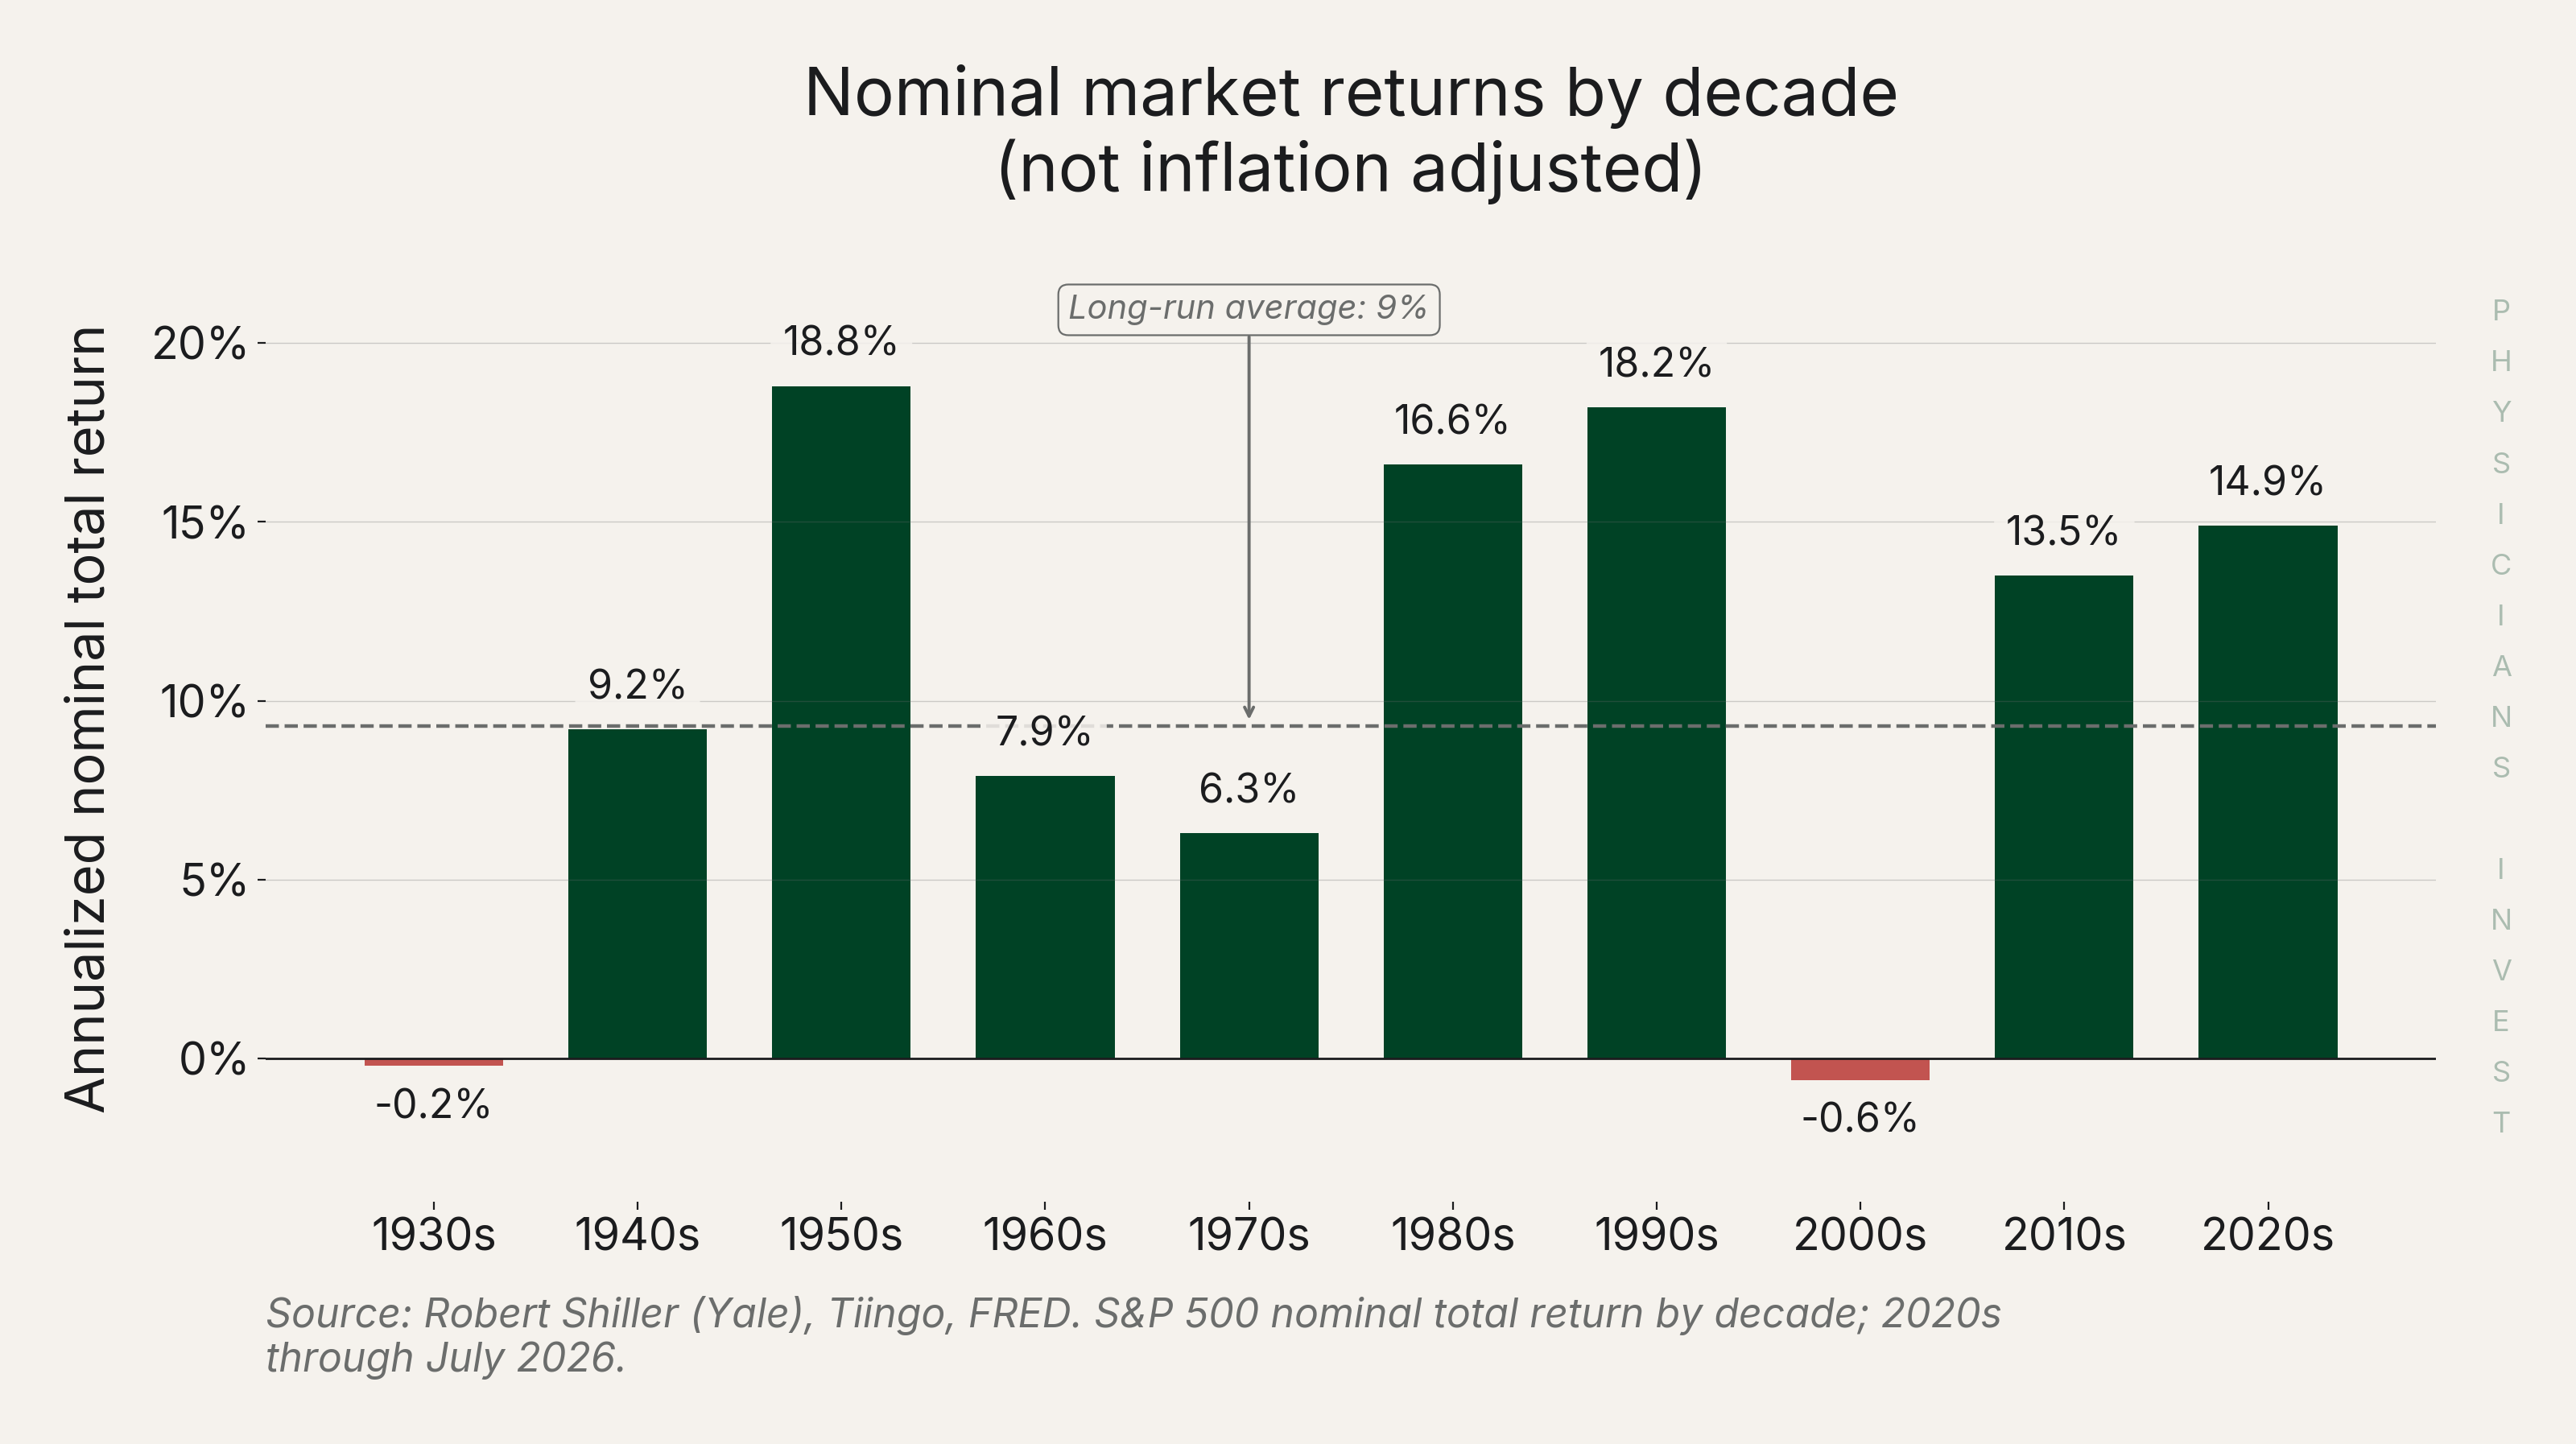
As is clear from the chart above, a 2.5% expected return is below every rate you carry: a 6.55% mortgage, a 7% car loan, an 8% student loan. Before incorporating any taxes, paying down the debt already wins based on expected earnings yield. This isn't always the case and there are times when the market earnings yield is so high that it would be much better to invest than to pay off debt. The decision is dynamic and today the odds are against the market doing as well as it has over the past decade. Below is a chart of market returns by decade.
 Source: Robert Shiller (Yale), Tiingo, FRED
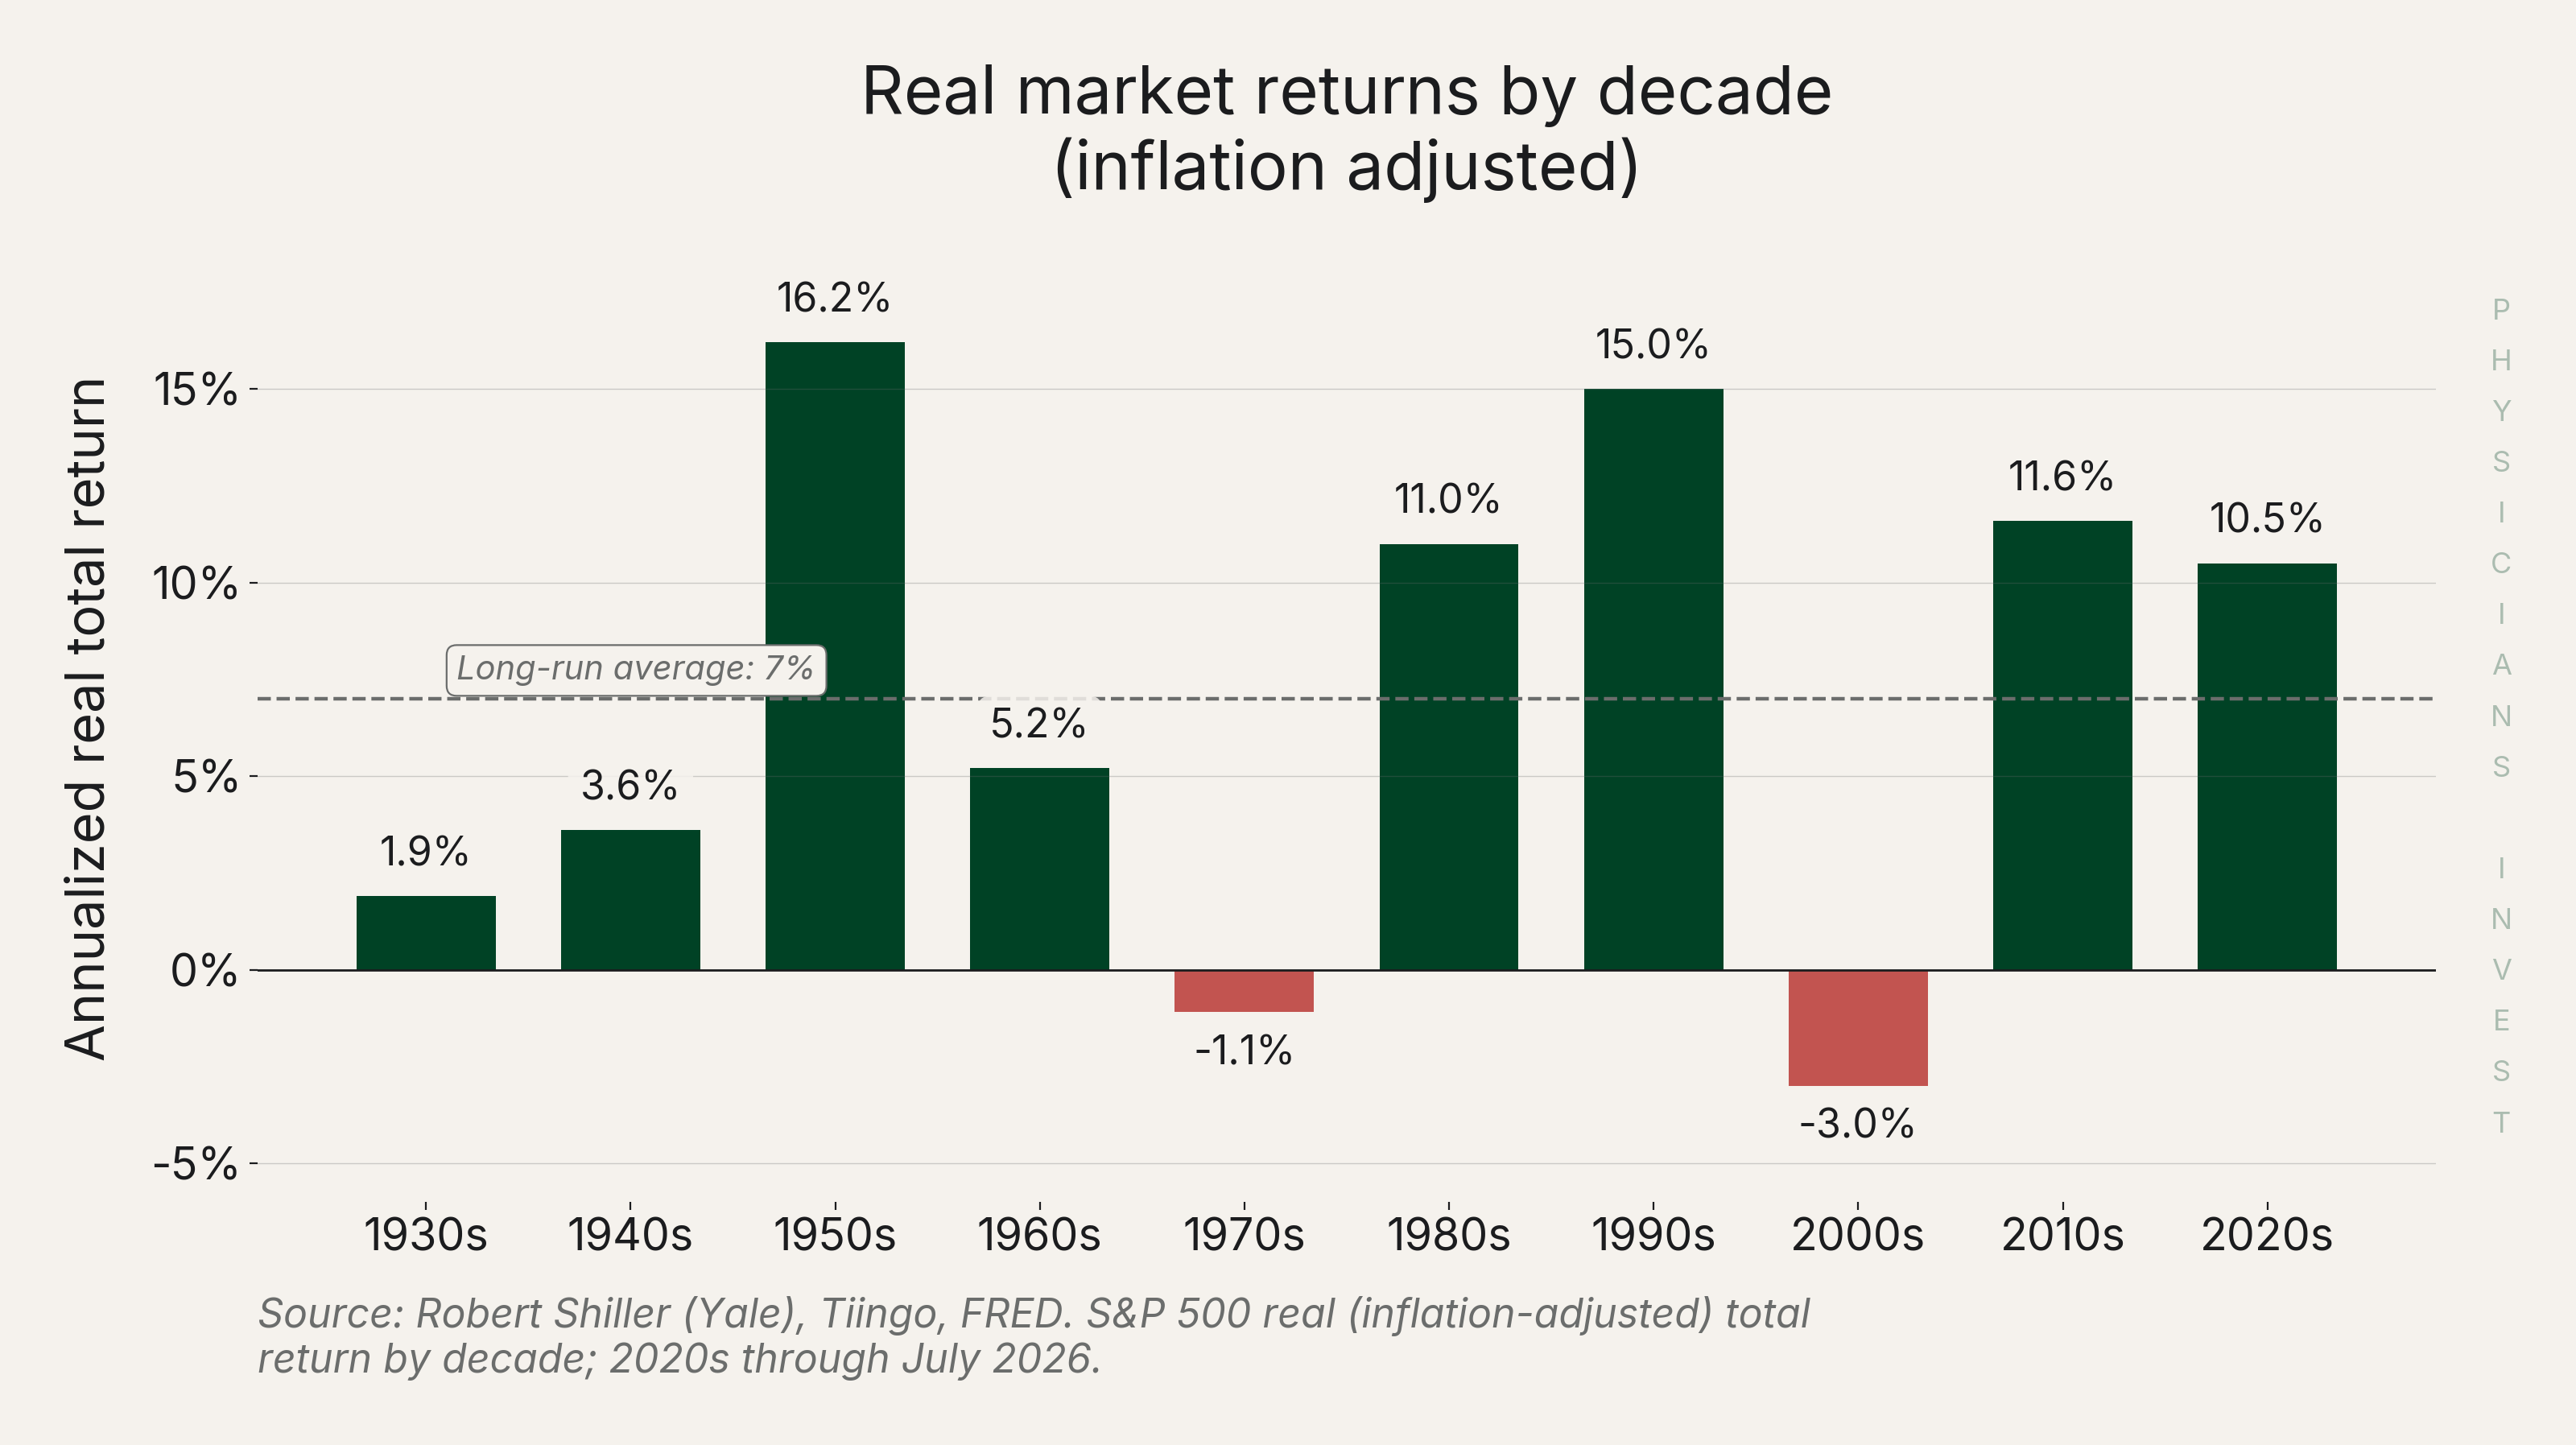
Notice most every decade was positive return but a wide dispersion exists decade to decade. Now, let's take out inflation and see what that does to the same chart.
 Source: Robert Shiller (Yale), Tiingo, FRED
Two of the last six decades lost money after inflation. We think inflation is more likely to run hot than cold from here, given today's political and monetary incentives, so most investors should calibrate expectations to real returns that adjust for inflation.
To be clear, none of this is a prediction. There's no gravity rule for financial markets. It's a machine made up of individuals, not physics and rules, and stocks could run a lot higher from here. We like to think in terms of probabilities and that is why we view expected real market returns going forward to be lower than the previous decade.
The debt side: psychological handcuffs
Debt is just pulling the future forward to today. You buy the life now, and you pay for it later. This is a real cost because it puts you in handcuffs that are difficult to get out of and psychologically taxing. Paying debt down buys back optionality. The freedom to go part-time, to walk away from a bad group, to say yes to the next opportunity. For a physician staring down decades of earning, that flexibility is worth more than a few points of hoped-for return and is a behavioral reason outside of the pure math that we think debt-paydown is often the superior choice to investing.
The tax side: after-tax evaluation is paramount
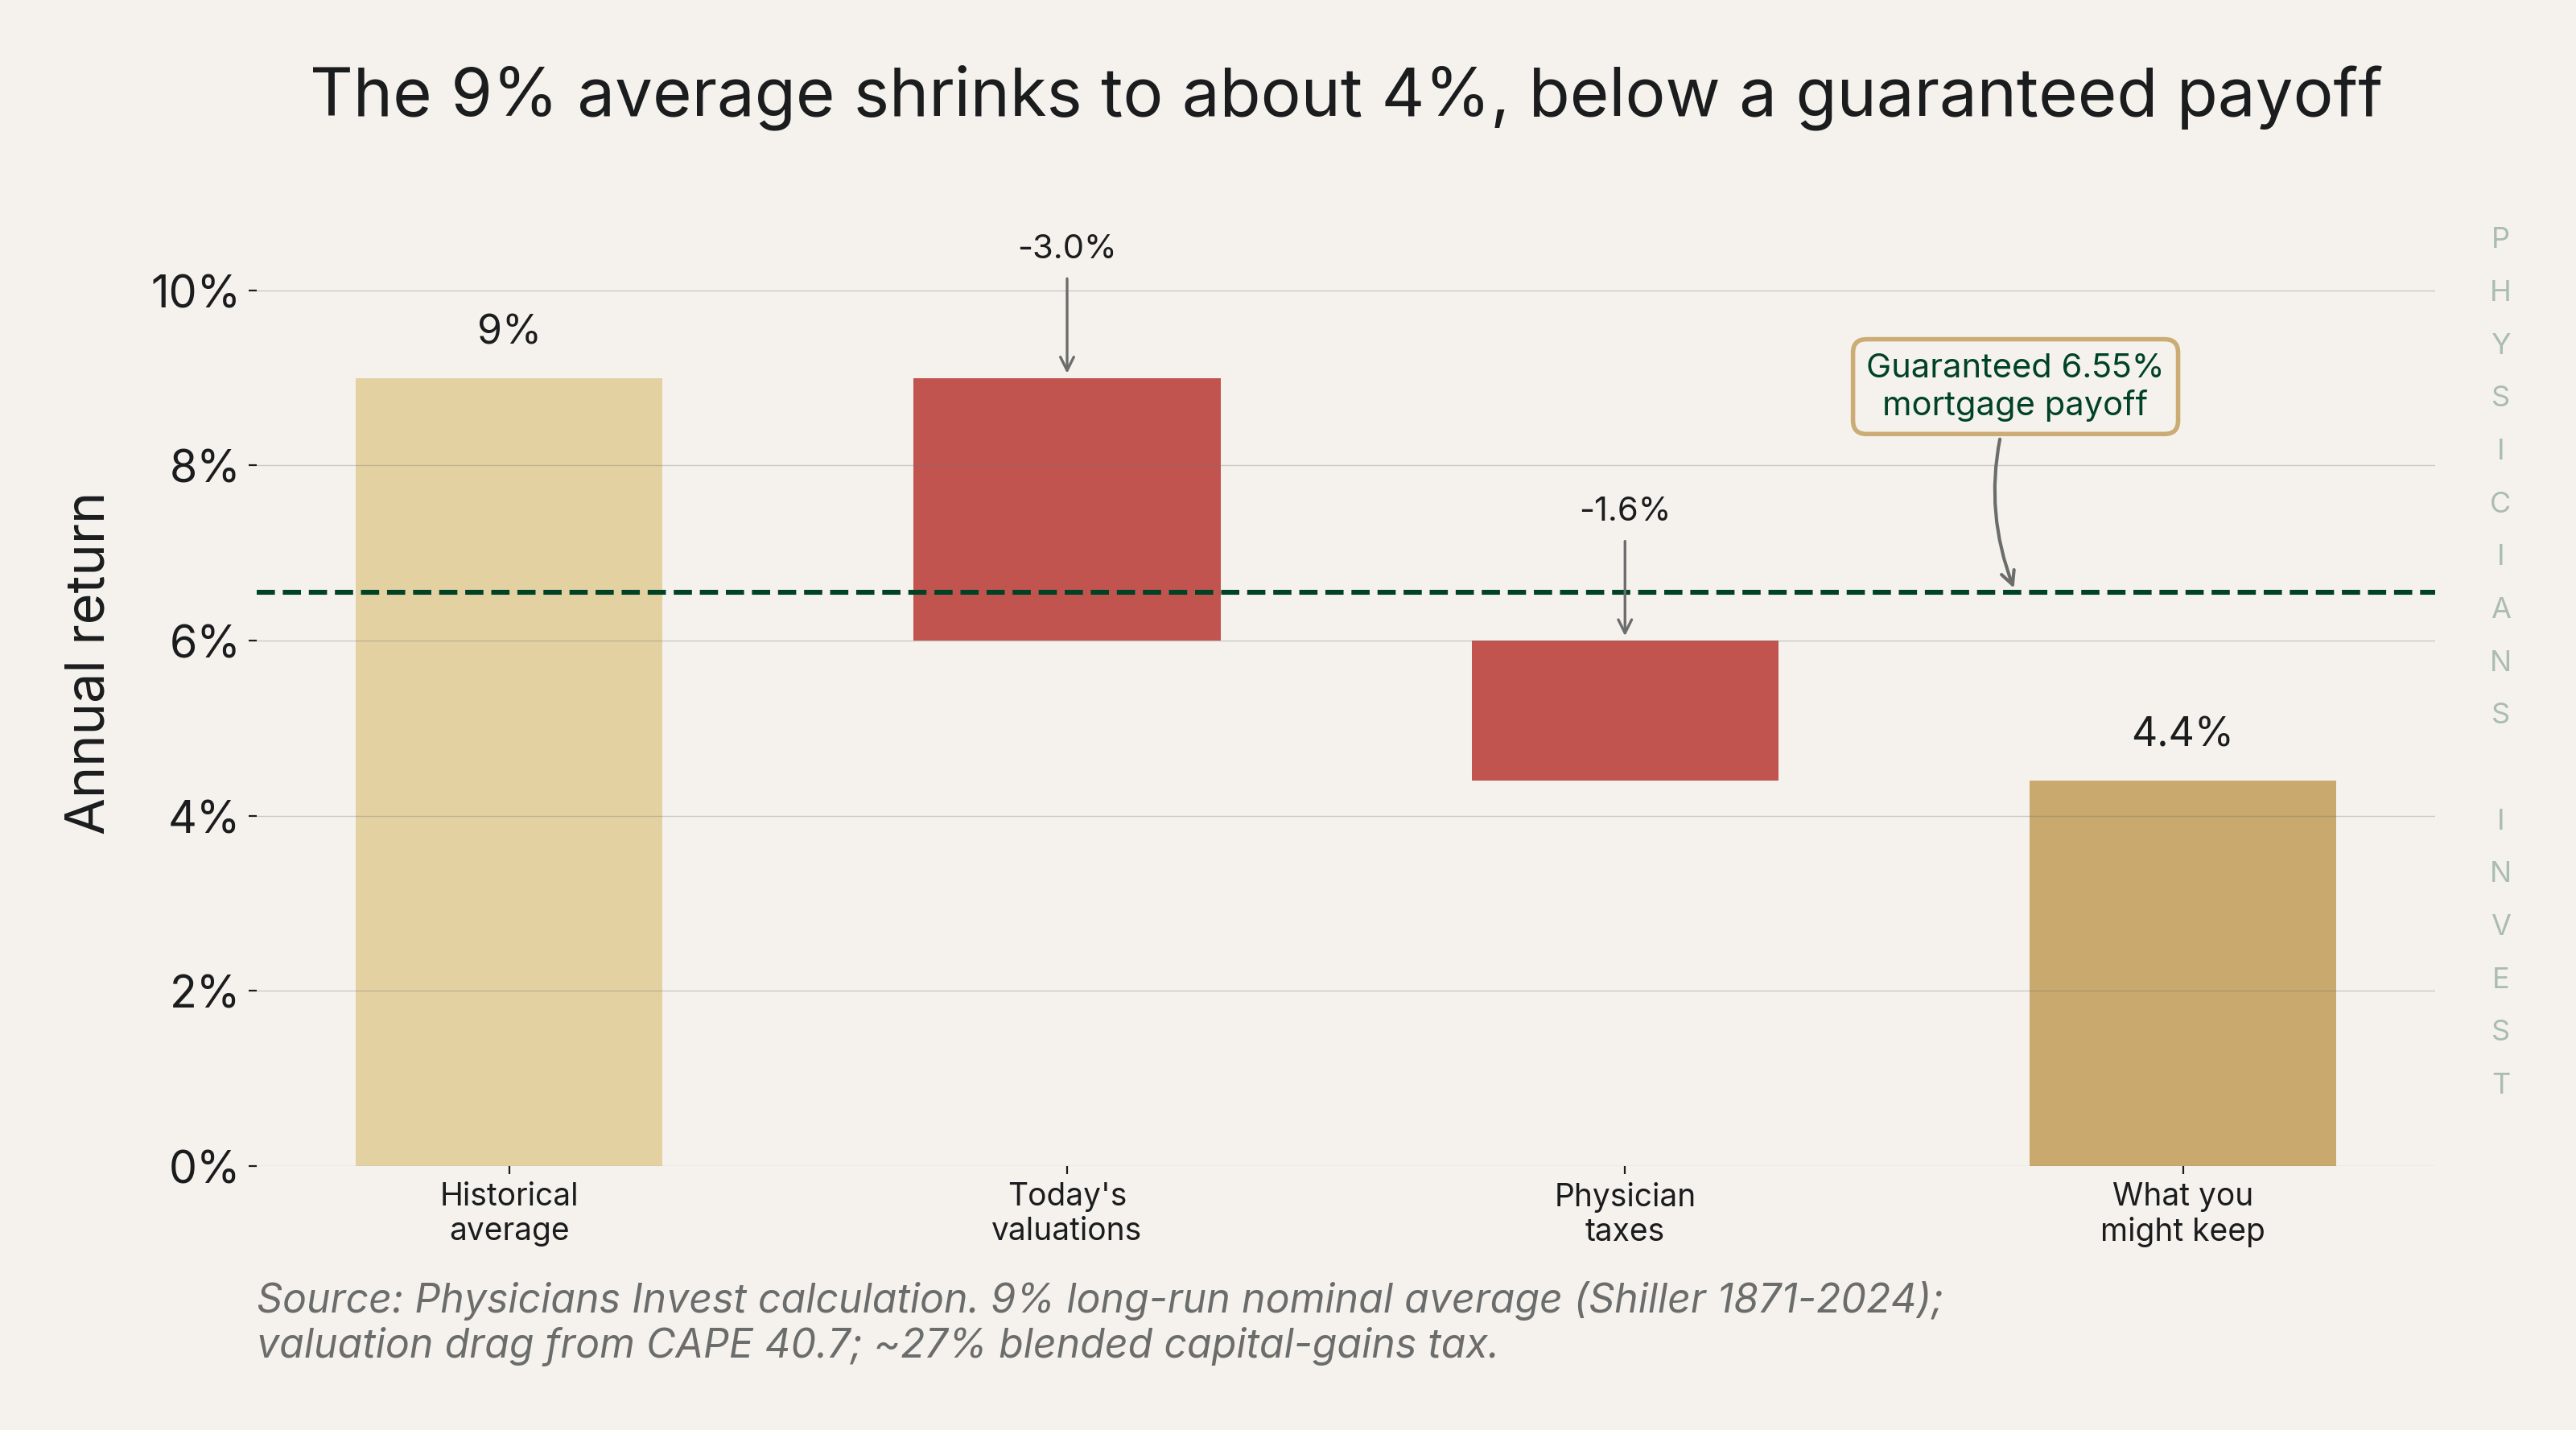
Everything we have discussed above was pre-tax. Add in a physician's tax bracket and the case becomes even stronger. As an example, if you pay off a 6.55% loan, you effectively returned 6.55% to your total net worth and weren't taxed at all on it. If you invest instead, you owe capital-gains tax when you sell. This makes a rosy 10% net about 6.6% to 7.6%, after-tax. Not quite as pretty.
 Source: Physicians Invest calculation
There's a second wrinkle that hits physicians specifically. The deductions that shrink a typical earner's debt cost are mostly gone at your income. The student-loan interest deduction phases out above $200,000 of income (IRS Publication 970), and with the 2026 standard deduction at $32,200 for a couple, most physicians don't itemize their mortgage interest either. So your after-tax debt rate is the full rate and you don't get any haircut on deductions.
 Source: Physicians Invest calculation
The Move
Here's the framework to use going forward:
- Capture your full employer match and fill tax-advantaged space first (HSA, 401(k), backdoor Roth, converting after-tax contributions into a Roth IRA to get around the income limits) before worrying about debt paydown or investing.
- Write out every debt and the rate you owe on each.
- Attack the highest rate first.
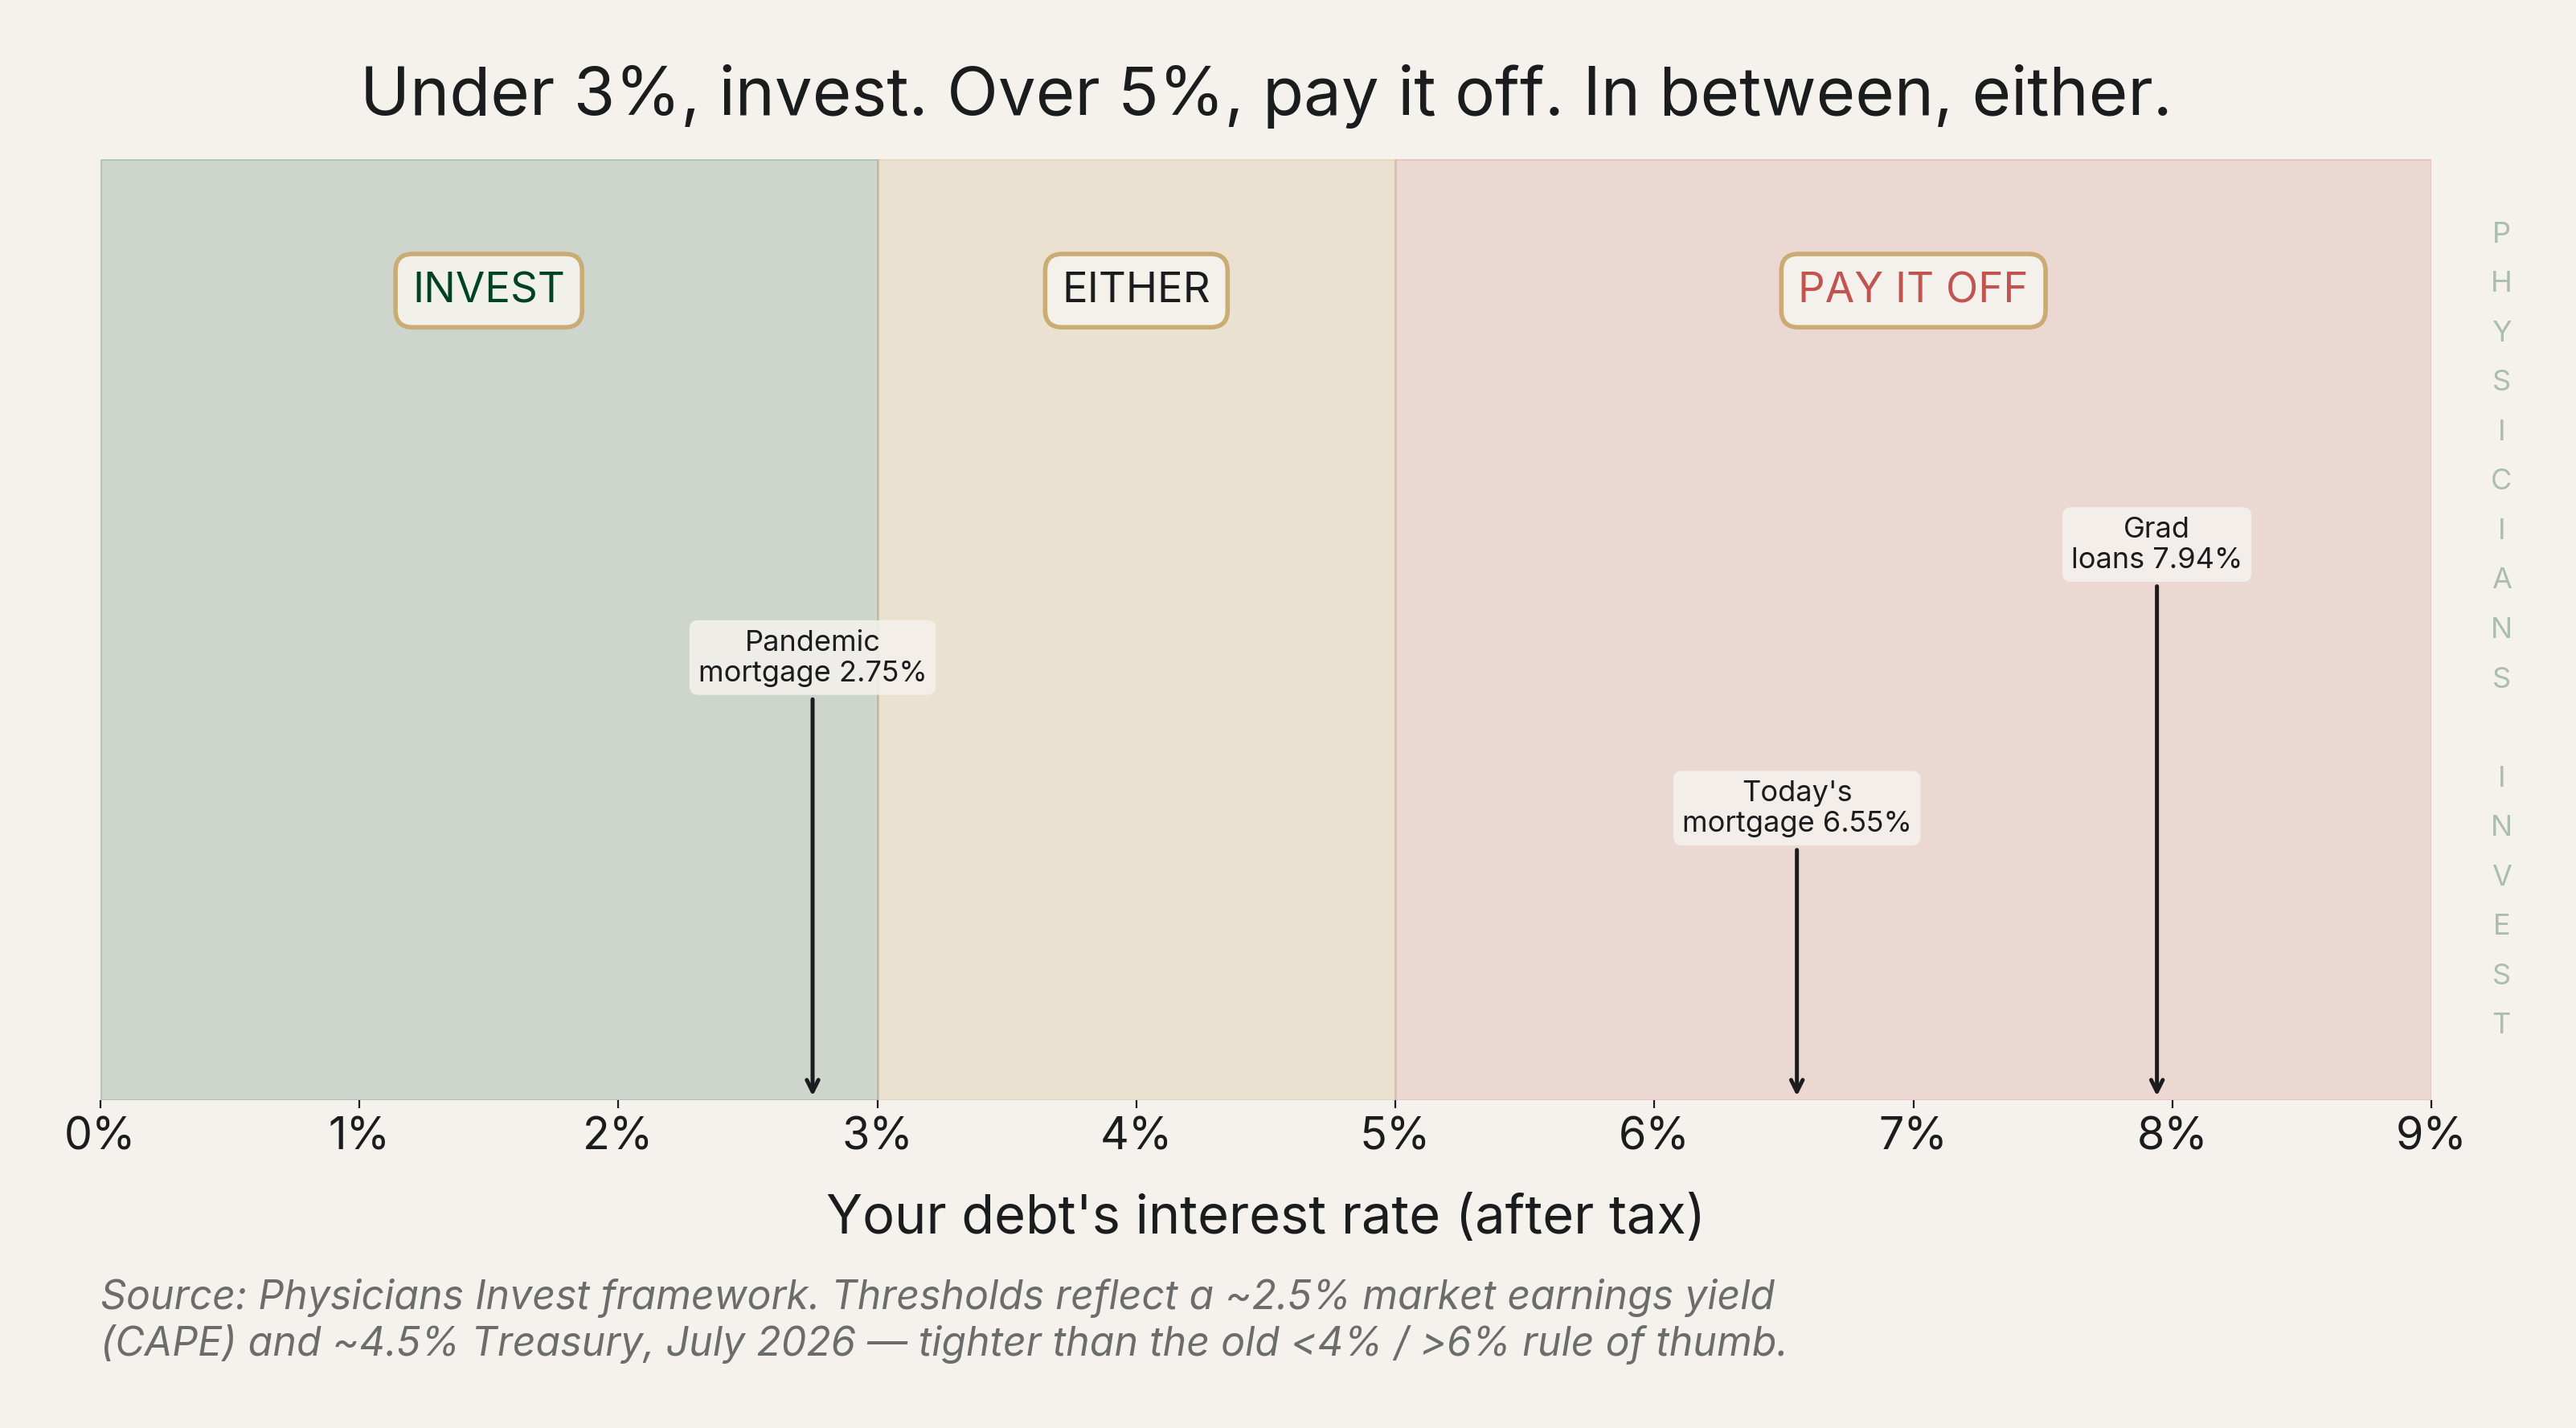
- Use a 4% hurdle: above 4%, pay it off. Below 4% (or on track for forgiveness like PSLF), carry it and invest the difference.
 Source: Physicians Invest framework
That chart bakes in today's low expected market return, so the middle is a gray zone rather than a hard line. Our 4% hurdle sits inside that band, and above it we lean toward paying off.
Even if you miss the market going higher, there will always be opportunities that come along to invest. Take the bird in the hand and pay off debt above your hurdle first. Just remember this is a point-in-time call: if the market falls significantly from here, the math can swing back toward investing.
Sources
Data
- Shiller CAPE ratio (multpl.com) and Robert Shiller, Yale historical data
- FRED, 10-Year Treasury (DGS10)
- Freddie Mac Primary Mortgage Market Survey
- Bankrate auto loan rates
- Federal Student Aid, Direct Loan interest rates 2025-26
- AAMC medical student debt fact card, Class of 2024
Analysis
- Amromin, Huang & Sialm, "Mortgage prepayments vs. tax-deferred saving," NBER WP 12502
- Clifford Asness, "Fight the Fed Model," AQR
Policy
- IRS Publication 970, Tax Benefits for Education (student-loan interest deduction)
- IRS, 2026 inflation adjustments / OBBBA standard deduction
Related from Physicians Invest