These are hypothetical model portfolios for educational purposes only. They do not represent actual investments, do not account for transaction costs or taxes, and are not personalized investment advice. Past hypothetical performance does not guarantee future results. Physicians Invest does not manage client assets. Consult a qualified financial advisor before making investment decisions.
The 2-Minute Version
- All three model portfolios are now in the green after the April rebound. Sturdy+ leads at +11.5%, Simple at +8.5%, Sturdy at +8.2% (Year-to-Date)
- Simple performance is essentially tied with the S&P 500 (+8.3%); Sturdy+ sits 3.2% ahead for comparison
- 60% Stocks/40% Bonds (60/40) still lags at +5.9% Year-to-Date
- No portfolio changes this month.
Market Context
After Q1's sell-off, stocks reversed strongly to the upside in April as the Iran conflict moved toward a ceasefire. Bonds, Gold, and Energy sectors ended the month about where they started the month.
Note the performance of the Sturdy portfolios throughout the first 4 months of the year in the chart below. They sidestepped the S&P 500 drawdown of Q1 and were still able to participate with the subsequent rally in April. On a risk-adjusted basis, both portfolios show stronger Sharpe & Sortino ratios than either benchmark so far this year (don't get hung up on the jargon here - they are simply industry standard "return per unit of volatility" metrics). Taking a look at the plots shows the visual representation of this.
Performance Dashboard
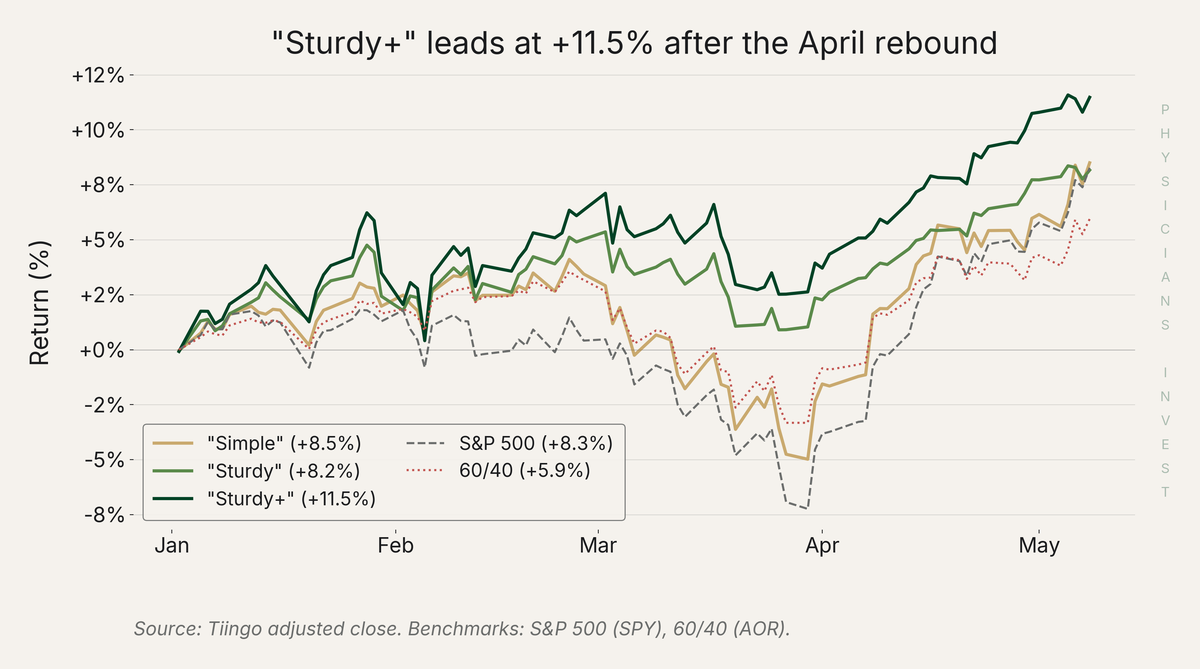 Source: Physicians Invest model portfolio. Hypothetical $100K, not actual returns.
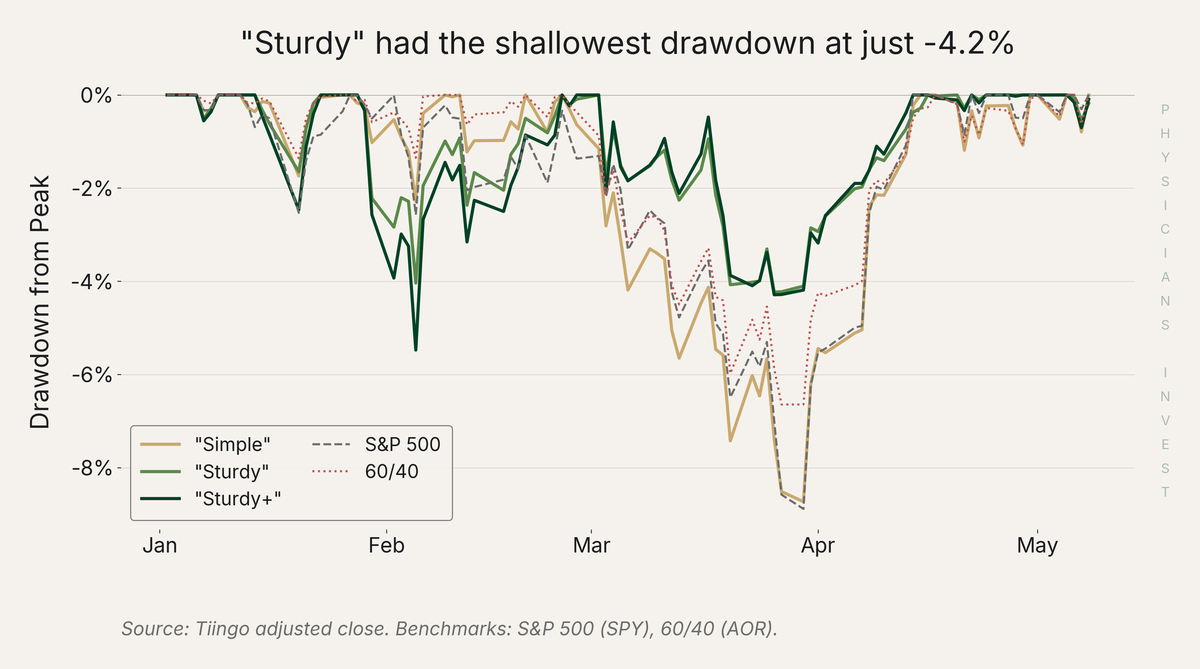
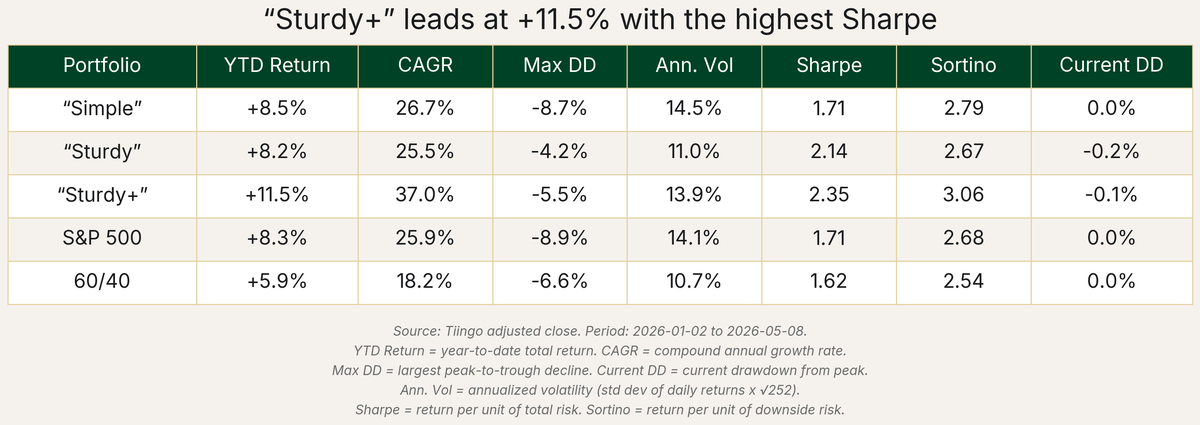
The table above compares the model portfolios against the S&P 500 and AOR (a 60/40 proxy ETF). The two columns I would focus on are YTD Return (Year-to-Date) and Max DD (Maximum Drawdown; the deepest decline). Notice how much more stable Sturdy and Sturdy+ portfolios are.
1. "Simple" Portfolio
For: Residents and early-career physicians who want a "set it and forget it" approach
Strategy: Three ETFs at 60/30/10. Beauty in simplicity.
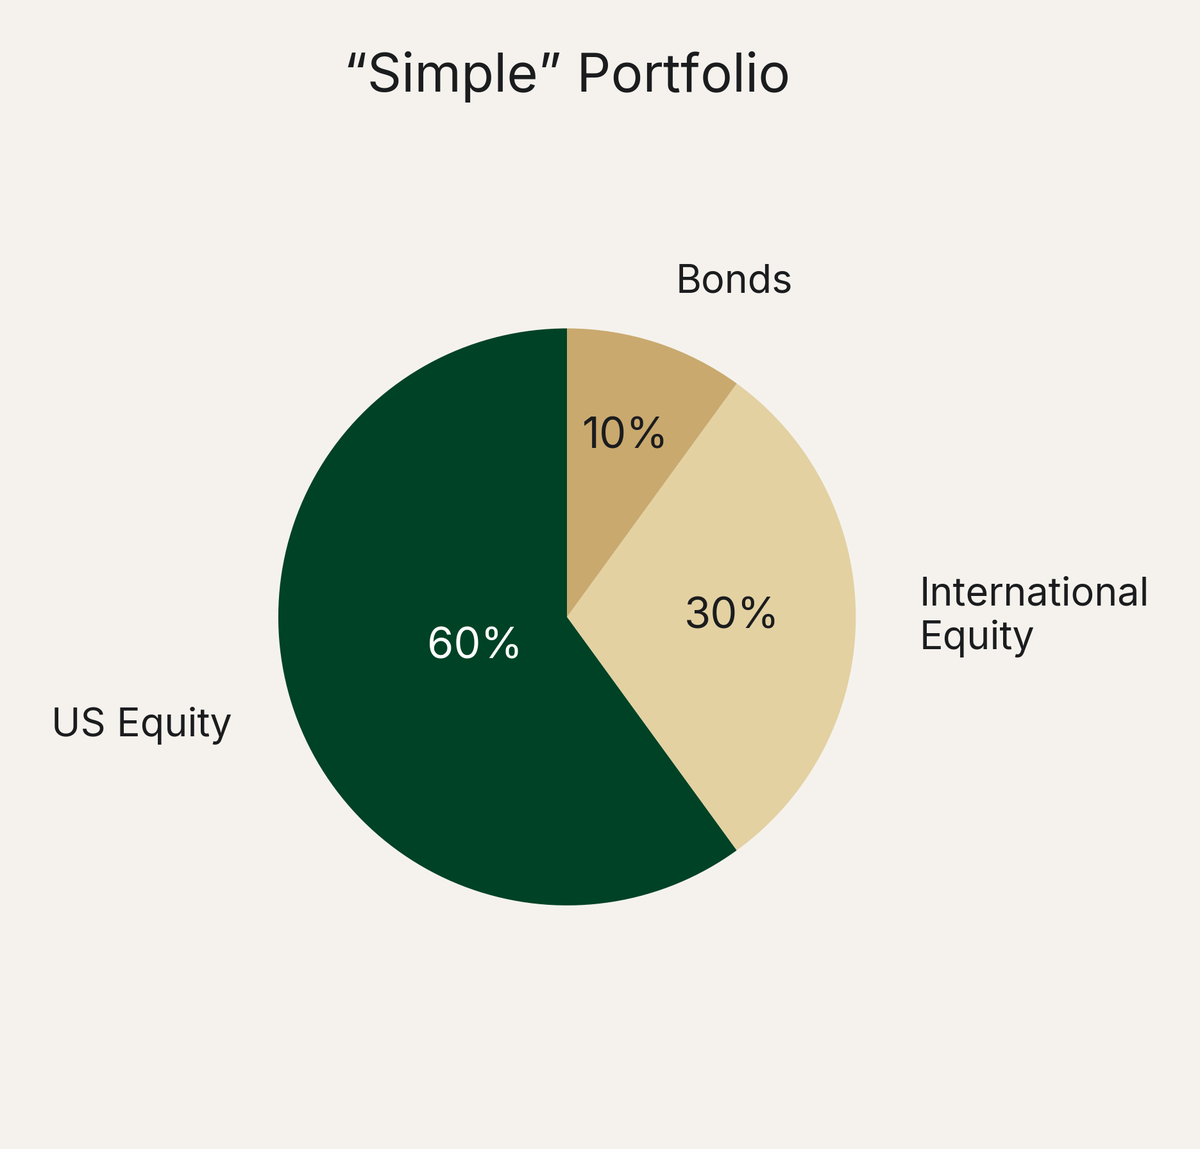
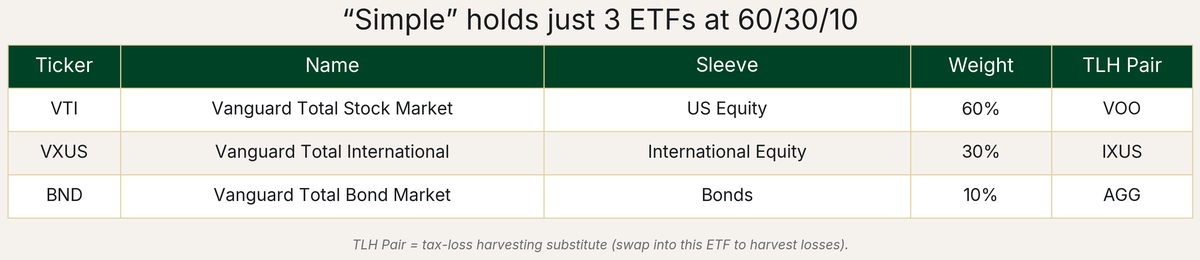
Advantages: Lowest expense ratios in the lineup (under 0.05% blended). Easy to rebalance with three line items. No exotic holdings.
Disadvantages: Concentrated in stocks and bonds. When both go down together (like Q1 2026), there is nowhere to hide. Diversifies across assets but does not perform well when interest rates are increasing (2022).
What Changed
No changes. The Simple portfolio is designed to be left alone.
Tax-Advantaged Tweak
In a Roth or 401(k), investors who want real-estate exposure typically add a 5-10% REIT (real estate investment trust) slice carved from US equity (VNQ is one common option). REITs throw off ordinary income that gets taxed at the marginal rate in a taxable account, but in a tax-shielded bucket that doesn't matter.
2. "Sturdy" Portfolio
For: Mid-career attendings who want a smoother ride without giving up return
Strategy: 40% equity / 30% managed futures / 20% hard assets / 10% bonds
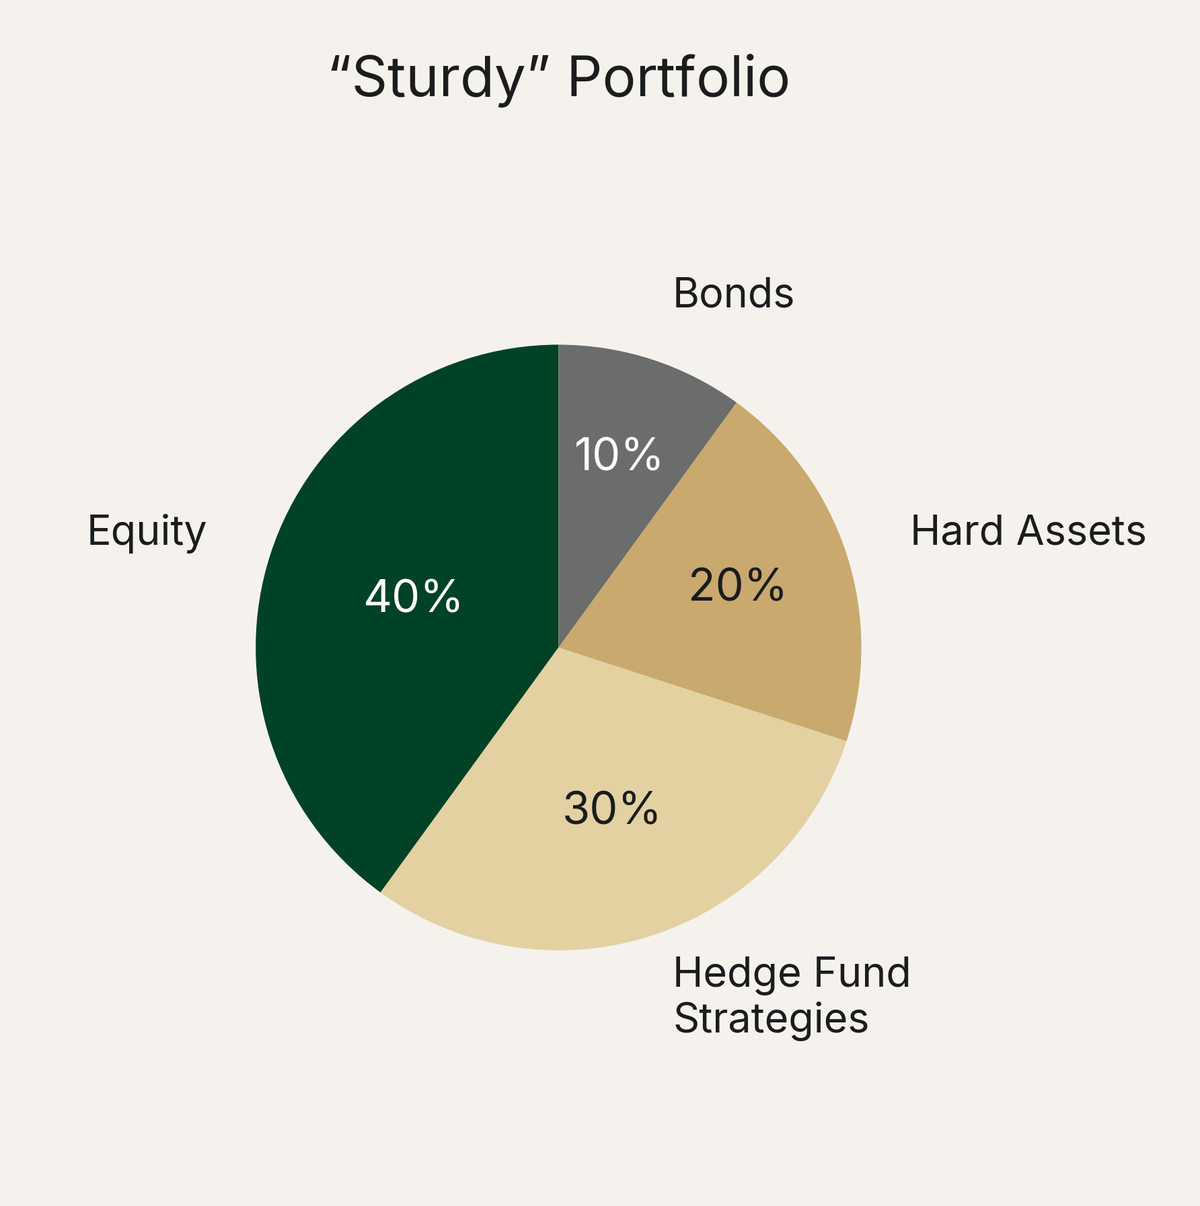
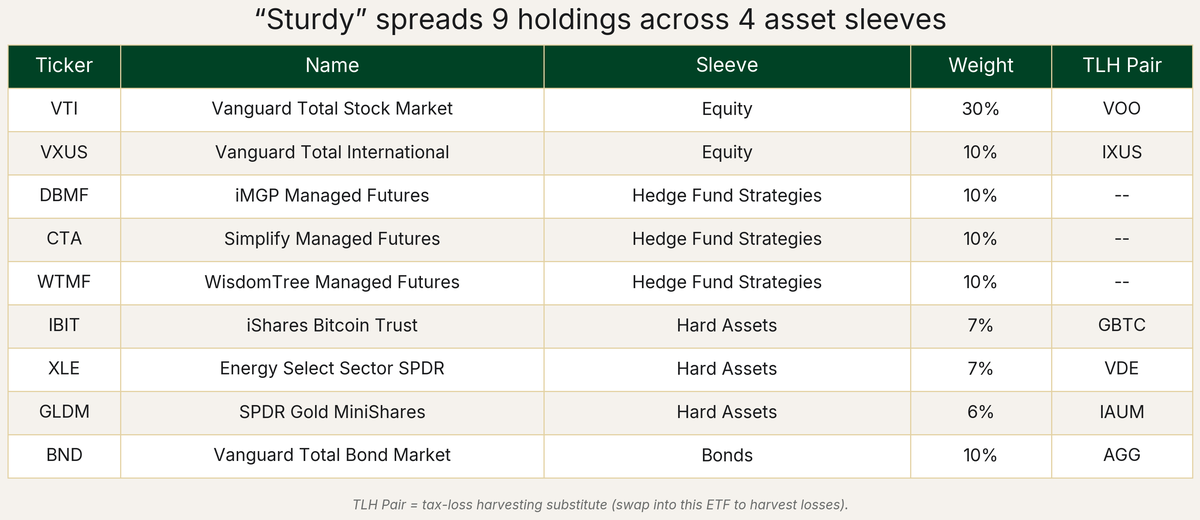
Advantages: Lower volatility for the same performance as Simple portfolio. A much smoother ride without giving up return. Diversifies risk exposures away from just stocks.
Disadvantages: Nine holdings means more rebalancing complexity than Simple. Hedge Fund ETFs have higher expense ratios (0.65-0.85%) than the equity sleeves and require some educational efforts to understand why, how, and when they make money.
What Changed
No changes. The 40/30/20/10 mix is built to survive multiple regimes without being tinkered with monthly.
Tax-Advantaged Tweak
For asset location, place more BND, GLDM, WTMF, CTA, and DBMF exposure in tax-sheltered accounts and more index fund exposure in taxable brokerage accounts (VTI, VXUS, XLE, IBIT).
Tax Loss Harvesting Pairs
Tax-loss harvesting (TLH) pairs ready if needed: VTI/VOO, VXUS/IXUS, IBIT/GBTC, XLE/VDE, GLDM/IAU, BND/AGG. DBMF, CTA, and WTMF do not have direct TLH substitutes; they cover each other inside the managed futures sleeve.
3. "Sturdy+" Portfolio
For: Sophisticated investors comfortable with leveraged ETF mechanics looking for higher long-term returns than market and are willing to take on volatility
Strategy: 150% total exposure via stacked ETFs (RSSB, RSST, RSSY, GDE)
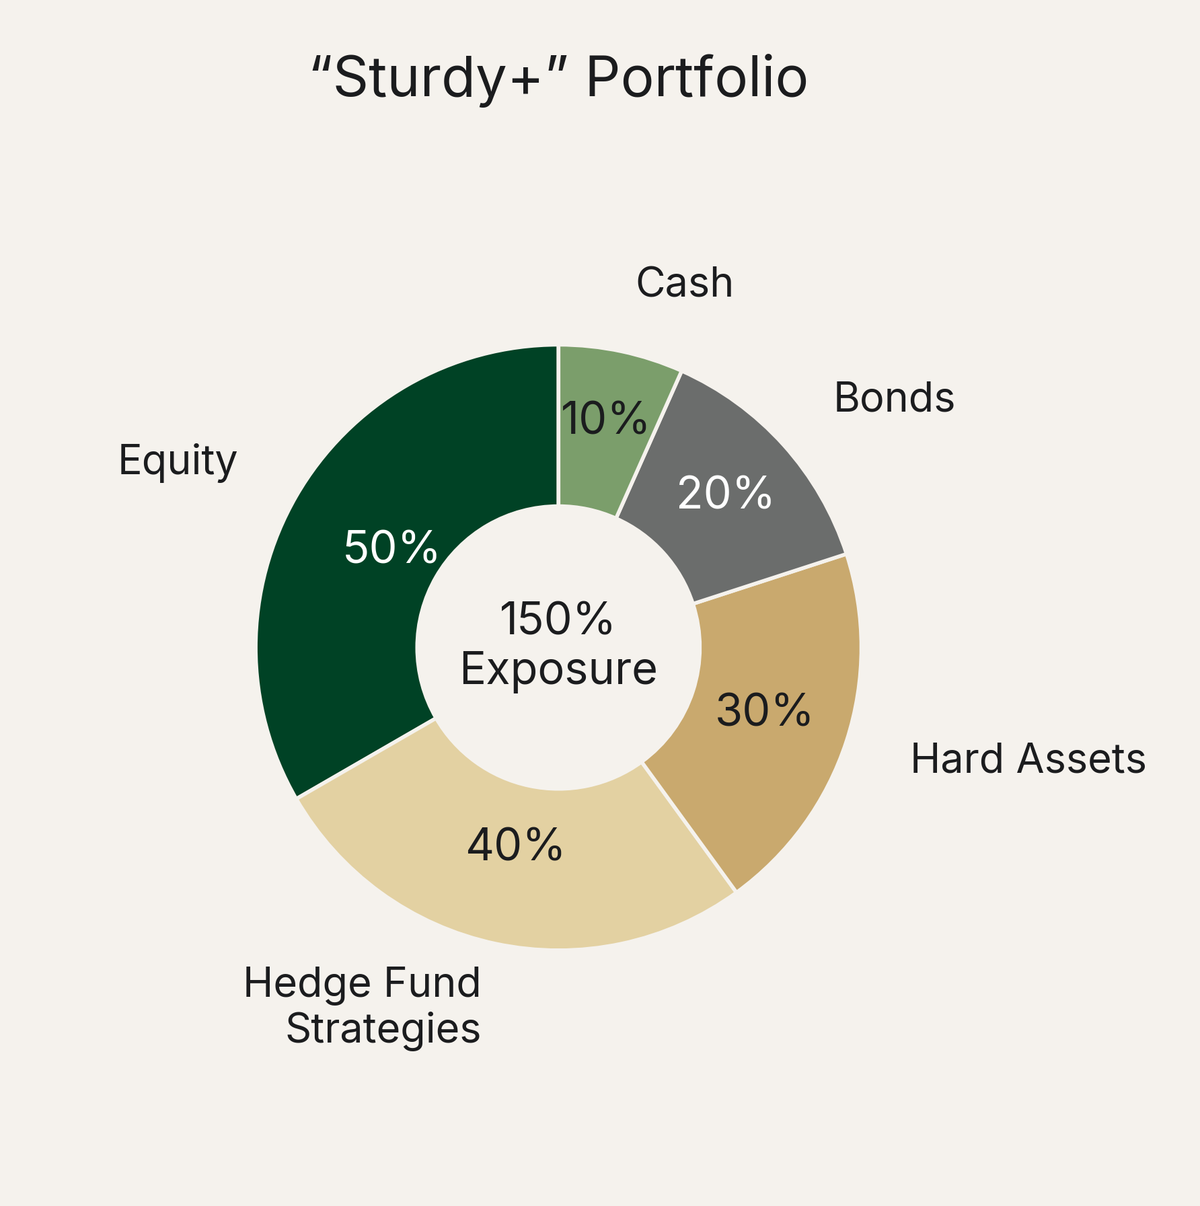
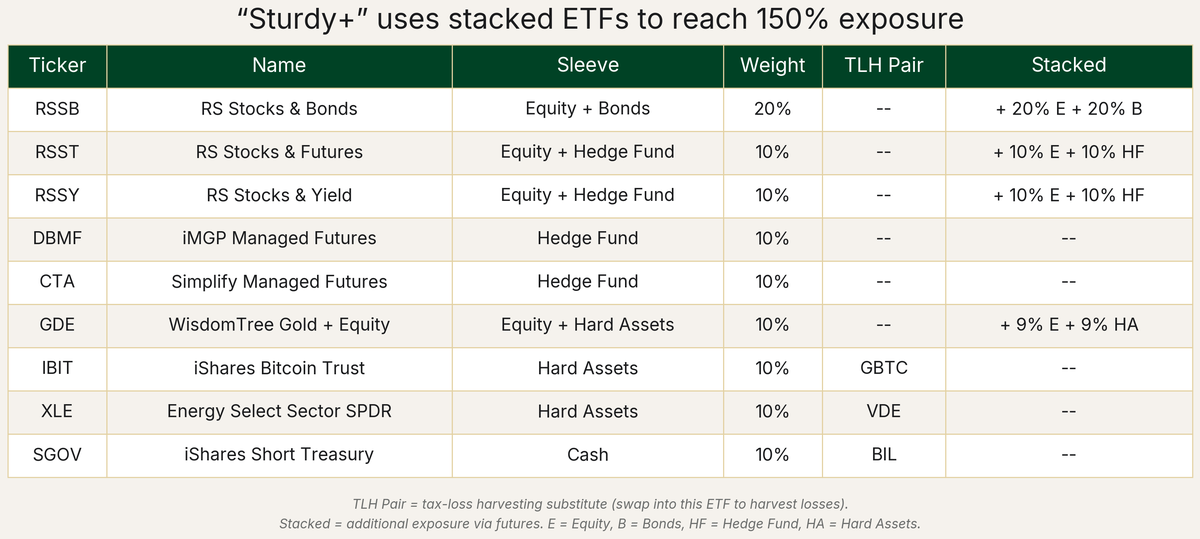
Advantages: Capital Efficiency allows for 150% exposure while only deploying 100% of capital. Broker margin is not needed so the investor avoids any risk of margin calls (and avoids inflated borrowing rates). Investors simply purchase these ETFs like any other, and the stacked exposures are already baked in. Futures-based holdings receive 60/40 tax treatment (60% taxed as long-term gains, 40% as short-term, regardless of holding period), making this more tax-efficient than you might expect for a leveraged strategy.
Disadvantages: More volatile than "Sturdy" due to the additional exposure. More complex to understand and requires significant effort to understand mechanics. Stacked ETFs are newer products with shorter track records. Requires comfort with leverage and futures, even though the implementation is straightforward.
What Changed
No changes. Rebalance quarterly.
How the Leverage Works
Four holdings provide stacked exposure:
- RSST (10% of portfolio) = 10% US equity + 10% managed futures (trend following)
- RSSY (10% of portfolio) = 10% US equity + 10% managed futures (carry/yield)
- RSSB (20% of portfolio) = 20% global equity + 20% bonds
- GDE (10% of portfolio) = 9% US equity + 9% gold
Think of stacked ETFs like combination drugs: Augmentin gives you amoxicillin plus clavulanate in one pill. RSST gives you S&P 500 plus managed futures in one ticker. Combined with the standalone holdings (DBMF, CTA, IBIT, XLE, SGOV), total exposure reaches approximately 150% while only deploying 100% of capital. No broker margin required, and a much lower effective borrowing rate than broker margin.
Tax-Advantaged Tweak
Investors typically prefer holding SGOV in tax-advantaged accounts (Roth, 401(k), 403(b)). Bond interest is taxed at ordinary income and benefits more than the other ETFs from sheltering in tax-advantaged vehicles.
Methodology
These model portfolios track a hypothetical investment made on January 2, 2026. All prices use adjusted close from Tiingo (accounts for splits and dividends). No transaction costs, slippage, or taxes are modeled. Benchmarks: SPY (S&P 500 ETF) and AOR (iShares Core 60/40 Balanced Allocation ETF, a 60/40 proxy). Metrics annualized where applicable. Sharpe and Sortino computed against a zero risk-free rate for simplicity.
The portfolios are account-agnostic. They work in taxable, traditional IRA, Roth IRA, 401(k), or any other account type. Tax-advantaged tweaks are noted per portfolio as suggestions, not requirements.
We will update these portfolios on the second week of every month. Small tweaks monthly and bigger rebalances quarterly. We will clearly note any and all changes and the rationale behind them.